Blogg
Här finns tekniska artiklar, presentationer och nyheter om arkitektur och systemutveckling. Håll dig uppdaterad, följ oss på Twitter
Här finns tekniska artiklar, presentationer och nyheter om arkitektur och systemutveckling. Håll dig uppdaterad, följ oss på Twitter

This blog post is mainly about updating the underlying software used in our blog series on building microservices. Most important is the upgrade of Spring Cloud to the Brixton release (v1.1 SR3) and upgrading the Docker development environment to Docker For Mac v1.12. Spring Boot has also been upgraded to v1.3.6.
We will also throw in a Spring Cloud Config server for externalised configuration and Spring Cloud Sleuth for handling correlation ids but the details regarding the configuration server and correlation ids will be saved for later blog posts.
The blog post basically repeats the tests performed in part 1 - 4 in the blog series, but on the upgraded versions. First we verify that we have installed the tools we need, then we will get the source code, build it and finally perform tests to verify that everything works.
If your are interested, here are some links to information on how to migrate source code from Spring Cloud v1.0 (the Angle release) to v1.1 (the Brixton release):
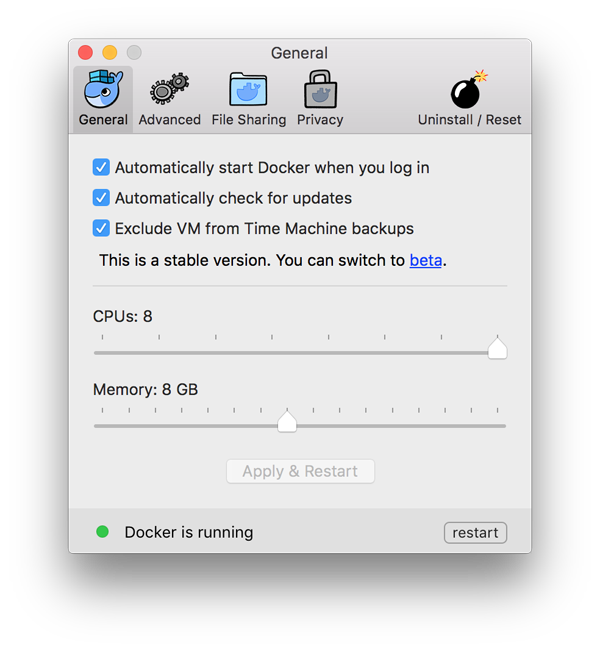
It is strongly recommended that you give your Docker environment a lot of memory and CPUs/cores. I have configured Docker for Mac to use all eight CPU cores available on my Mac and allocating up to 8 GM of memory if required:
Open a terminal and cd into a folder of your choice:
$ cd a-folder-of-your-choice
Since we have externalised our configuration into a configuration repository we first need to get it from GitHub:
$ git clone https://github.com/callistaenterprise/blog-microservices-config.git
Next, we get the source code from GitHub:
$ git clone https://github.com/callistaenterprise/blog-microservices.git
$ cd blog-microservices
$ git checkout -b B8 M8
Time to build our microservices with:
$ ./build-all.sh
Finally, we verify that we have docker images created in our docker environment:
$ docker images | grep blogmicroservices
blogmicroservices_rev         latest              02a156c0e27d        3 days ago          126.1 MB
blogmicroservices_composite   latest              1c7b4d313595        5 days ago          128.2 MB
blogmicroservices_pro         latest              315c508ee5c9        5 days ago          126.1 MB
blogmicroservices_auth        latest              e7ec2f569efc        5 days ago          106.4 MB
blogmicroservices_edge        latest              501ea469296d        5 days ago          125.2 MB
blogmicroservices_rec         latest              d0331cbe7451        5 days ago          126.1 MB
blogmicroservices_config      latest              5452ef106f6a        5 days ago          126.9 MB
blogmicroservices_discovery   latest              82c0cc4f1f71        5 days ago          124.1 MB
blogmicroservices_monitor     latest              a142cf8fe027        5 days ago          109.7 MB
Now, we can start up the microservices as Docker containers:
$ docker-compose up -d
We can follow the startup procedure with the command:
$ docker-compose logs -f
…once the output from the logs stops rolling (takes a minute on my laptop) we can see if we can find our microservices in the discovery server (Netflix Eureka)
In another terminal window, try the following curl command:
$ curl -s -H "Accept: application/json" http://localhost:8761/eureka/apps | jq .applications.application[].name
It should respond with something like:
"REVIEW-SERVICE"
"CONFIG-SERVER"
"RECOMMENDATION-SERVICE"
"COMPOSITE-SERVICE"
"EDGE-SERVER"
"PRODUCT-SERVICE"
We can also open the following URL in a web browser to get a graphical representation of the same information:
It should look something like:
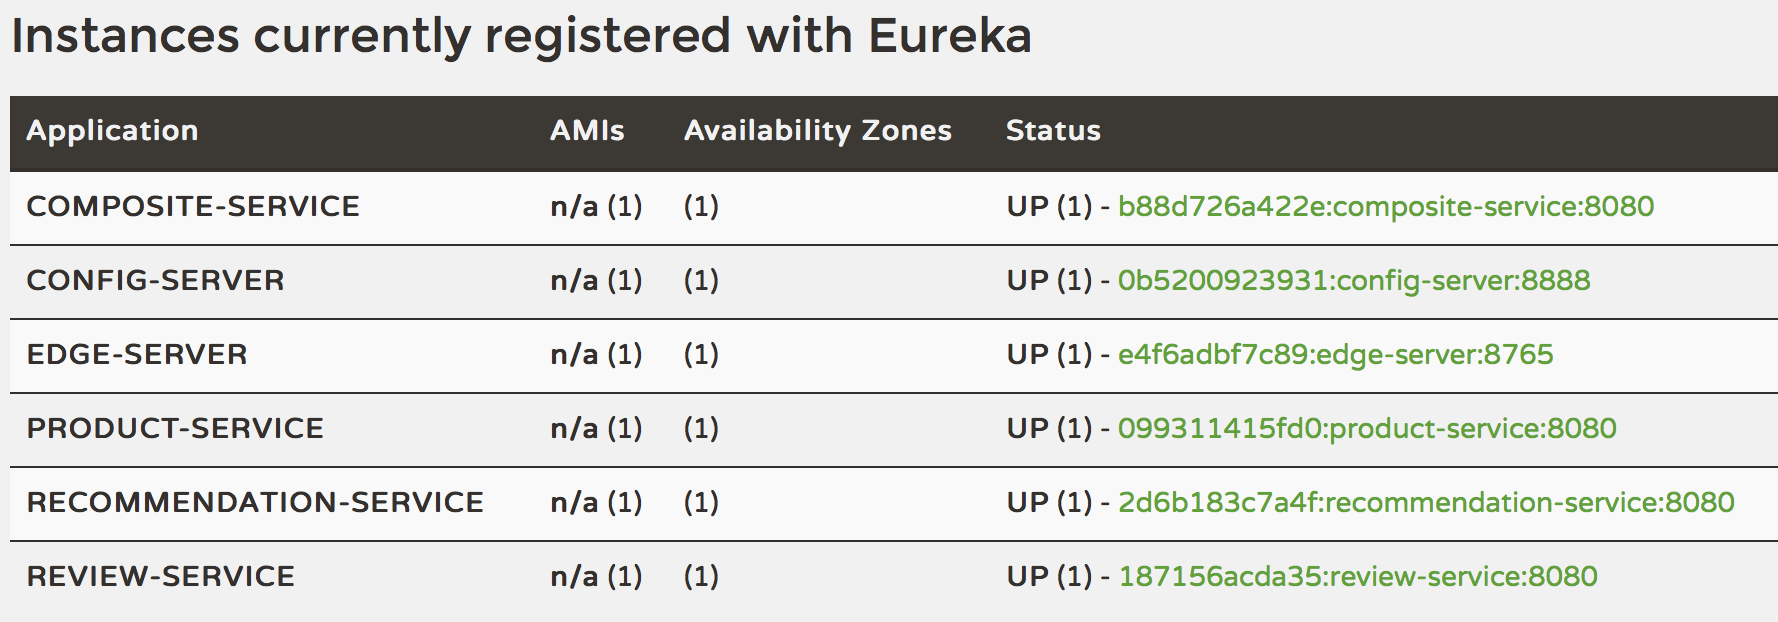
See Part 1 regarding details of the microservice landscape in the blog series.
First we will get an OAuth Access Token and execute a successful request using the Access Token.
Next we will use Docker to scale up and down the number of microservice instances.
Thirdly we will introduce problems into the microservice landscape and see how our circuit breaker, Netflix Hystrix, can be used to monitor and mitigate the problem.
Finally, we will use a shell script to fully automate an end-to-end test, including starting up a test environment, run tests and then bring the test environment down again.
Since our microservices are protected using OAuth we first need to get an OAuth Access Token. To avoid involving a Web Browser we will use OAuth resource owner password credentials grant flow:
$ TOKEN=$(curl -ks https://acme:acmesecret@localhost:9999/uaa/oauth/token -d grant_type=password -d client_id=acme -d username=user -d password=password | jq -r .access_token)
$ echo $TOKEN
f2340e30-2122-473c-9d6d-e9a27e912050
See Part 3 for details regarding use of OAuth.
Now, we can use the access token to execute a request to the microservice landscape:
$ curl -H "Authorization: Bearer $TOKEN" \
  -ks 'https://localhost/api/product/1046' | jq .
{
  "productId": 1046,
  "name": "name",
  "weight": 123,
  "recommendations": [ ... ],
  "reviews": [ ... ]
}
After a couple of requests the log should look something like:
composite_1  | 2016-08-14 06:24:19.634  INFO [composite-service,ba5eab537ac321b4,ebb02a82821b3a0,false] 1 --- [  XNIO-2 task-2] s.c.m.c.p.s.ProductCompositeService      : Synch start...
pro_1        | 2016-08-14 06:24:19.641  INFO [product-service,ba5eab537ac321b4,8b39d9547a53e9ba,false] 1 --- [  XNIO-2 task-2] s.c.m.c.product.service.ProductService   : /product called, processing time: 7
rec_1        | 2016-08-14 06:24:19.663  INFO [recommendation-service,ba5eab537ac321b4,b406512ef768f18c,false] 1 --- [  XNIO-2 task-2] s.c.m.c.r.service.RecommendationService  : /recommendation called, processing time: 15
rev_1        | 2016-08-14 06:24:19.694  INFO [review-service,ba5eab537ac321b4,b5a63711698de4be,false] 1 --- [  XNIO-2 task-2] s.c.m.core.review.service.ReviewService  : /reviews called, processing time: 5
NOTE: In the log output you can see that the output from the four microservices contains one and the same correlation id, ba5eab537ac321b4. This is Spring Cloud Sleuth in action, more about that in a future blog post!
See Part 1 regarding details of the microservice landscape.
Scale up the Recommendation Service to two instances:
$ docker-compose scale rec=2
Creating and starting blogmicroservices_rec_2 ... done

Note output in the log!
Verify that we now have two instances:
$ docker-compose ps rec
         Name                        Command               State    Ports
---------------------------------------------------------------------------
blogmicroservices_rec_1   java -Dspring.profiles.act ...   Up      8080/tcp
blogmicroservices_rec_2   java -Dspring.profiles.act ...   Up      8080/tcp
Execute some new requests (as above) and note responses from both instances (rec_1 and rec_2) in the log:
rec_1        | 2016-08-14 06:32:11.900  INFO [recommendation-service,c7e72729ea4f882a,809aff42409141c4,false] 1 --- [  XNIO-2 task-4] s.c.m.c.r.service.RecommendationService  : /recommendation called, processing time: 12
rec_2        | 2016-08-14 06:32:12.839  INFO [recommendation-service,75f6a7a27a8c0bb4,a558db8647189c44,false] 1 --- [  XNIO-2 task-2] s.c.m.c.r.service.RecommendationService  : /recommendation called, processing time: 7
Scale down the Recommendation Service to one instance:
$ docker-compose scale rec=1
Stopping and removing blogmicroservices_rec_2 ... done
Verify that we only have one instance left:
$ docker-compose ps rec
Name                        Command               State    Ports
---------------------------------------------------------------------------
blogmicroservices_rec_1   java -Dspring.profiles.act ...   Up      8080/tcp
Execute some more requests and note responses only from rec_1 in the log:
rec_1        | 2016-08-14 06:34:11.198  INFO [recommendation-service,268a97317916e011,4aec1db3daf67fa9,false] 1 --- [  XNIO-2 task-6] s.c.m.c.r.service.RecommendationService  : /recommendation called, processing time: 8
rec_1        | 2016-08-14 06:34:13.094  INFO [recommendation-service,6fa3111ae02b02a0,7f6a62fa890afd70,false] 1 --- [  XNIO-2 task-7] s.c.m.c.r.service.RecommendationService  : /recommendation called, processing time: 10
See Part 4 regarding more information on how to use Docker.
We will now configure one of our microservices to respond slowly. This will make it possible to see our circuit breaker, Netflix Hystrix, in action. See Part 2 for background and details on the circuit breaker.
Our microservices use a Spring Bean, SetProcTimeBean, to calculate a simulated processing time. SetProcTimeBean calculates a random processing time given two configuration parameters: service.defaultMinMs and service.defaultMaxMs.
These parameters can be changed during runtime using the configuration server without require a restart of the affected microservice. See blog-microservices/util/src/main/java/se/callista/microservices/util/SetProcTimeBean.java for details.
Let’s try it out!
Change the processing time limits and the log level (to see some DEBUG logging) in the Review Service by editing the file review-service.yml in the configuration repository:
$ cd ../blog-microservices-config
$ vi review-service.yml
Remove the comment marks # in the file. After you are done, review-service.yml should look like:
service:
  defaultMinMs: 6000
  defaultMaxMs: 6000

logging.level.se.callista: DEBUG
Commit the change to the Git based configuration repository:
$ git commit -a -m "make review service slow and increase log-level to DEBUG"
$ cd ../blog-microservices
Ask the Review Service to reload its configuration:
(note that it responds with a list of the names of the updated properties)
$ docker-compose exec rev wget -qO- localhost:8080/refresh --post-data=""
["logging.level.se.callista","service.defaultMaxMs","service.defaultMinMs"]
Execute a new request to verify that the microservice now responds slower:
$ curl -H "Authorization: Bearer $TOKEN" -ks 'https://localhost/api/product/12345' | jq .
From the log output we can now see DEBUG level logging and that the processing time for the Review Service has increased to 6 sec:
rev_1 | 2016-08-14 06:45:23.036 DEBUG [review-service,1962e7e12f2d3f6b,4992a65717f568b6,false] 1 --- [ XNIO-2 task-11] s.c.microservices.util.SetProcTimeBean : Return calculated processing time: 6000 ms
This will cause the Composite Service to timeout its request to the Review Service and, using Netflix Hystrix, applying a fallback method to compensate for the missing response:
composite_1 | 2016-08-14 06:45:27.033 WARN [composite-service,1962e7e12f2d3f6b,e2ddef075bb6640,false] 1 --- [ HystrixTimer-8] s.c.m.c.p.s.ProductCompositeIntegration : Using fallback method for review-service
The result can be seen in the response from the Composite Service where the review part now comes from the fallback method in the Composite Service (e.g. simulating results from a cache instead from the Review Service):
  "reviews": [
    {
      "reviewId": 1,
      "author": "Fallback Author 1",
      "subject": "Fallback Subject 1"
    }
  ]
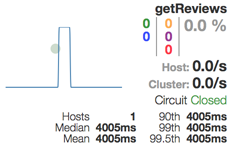
We can also monitor the state of our microservices using the Netflix Hystrix dashboard. Immediately after a failing request the dashboard should display a timeout error for the getReviews circuit like:
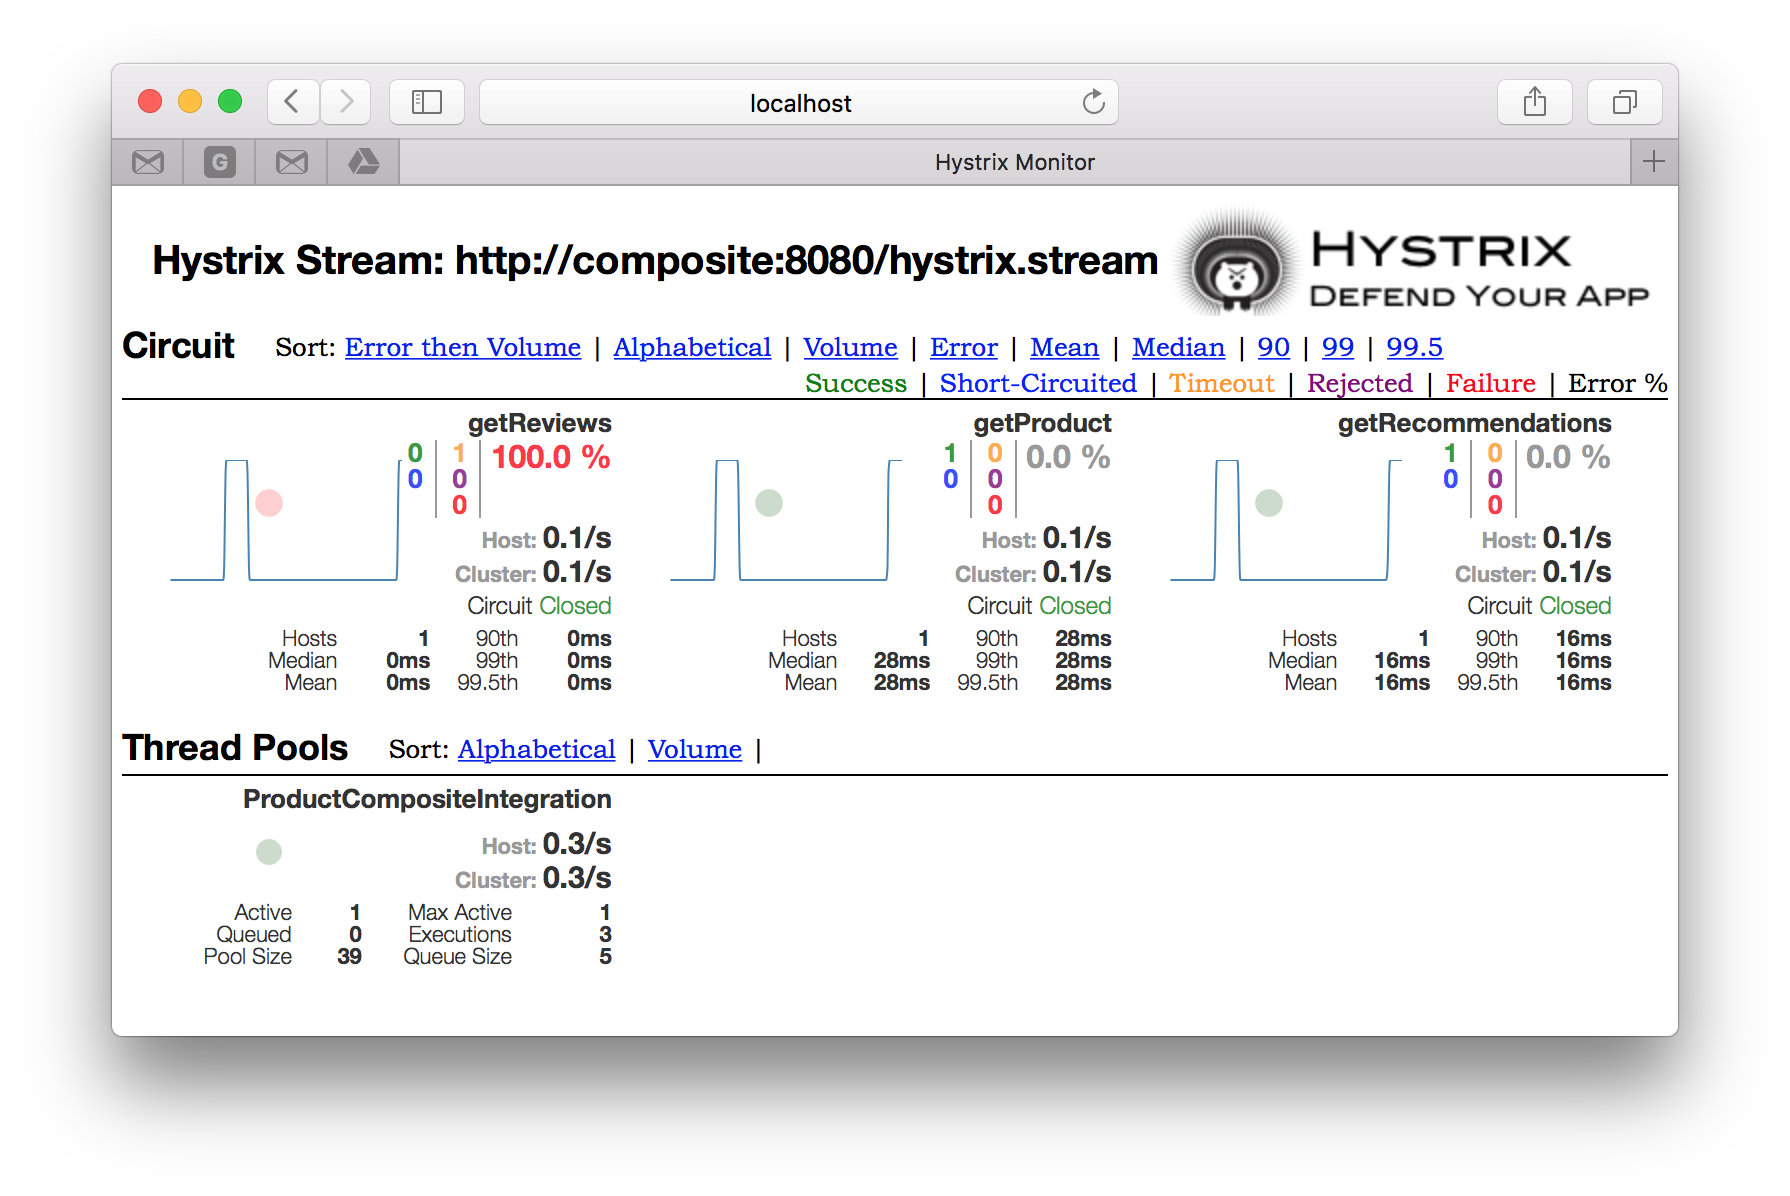
Since only one error is reported on getReviews, Hystrix keeps the circuit Closed, i.e. still allow requests to the Review Service to come through!
Now, we will make things worse. Force Hystrix to open the circuit by executing three requests immediately after each other. Verify that getReviews circuit now is Open in the dashboard like:
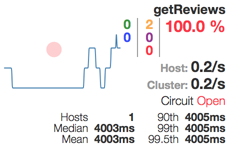
The dashboard reports two timeout errors on the getReviews circuit and the circuit is open, i.e. it does not allow calls to the Review Service!
If we execute a new requests to the API:
$ curl -H "Authorization: Bearer $TOKEN" -ks 'https://localhost/api/product/12345' | jq .
We will still get the fallback response in the review part, but the response is returned immediately. This means that the circuit breaker failed fast, i.e. never tried calling the Review Service!
After a while (30 sec in our configuration) the circuit breaker will allow a request to be passed to the Review Service, to see if the services is working again. Once the failing service is operational again the circuit breaker will detect this and close the circuit again. This means that the system landscape is self healing!
Let’s make the Review Service fast again!
First remove the changed response time limits and remove the debug log level in the configuration of the Review Service:
$ cd ../blog-microservices-config
$ vi review-service.yml
Add back the comment marks #. After you are done, review-service.yml should look like:
#service:
#  defaultMinMs: 6000
#  defaultMaxMs: 6000

#logging.level.se.callista: DEBUG
Commit the change to the git based configuration repository:
$ git commit -a -m "make review service fast again and decrease log-level to INFO"
$ cd ../blog-microservices
Ask the Review Service to reload its configuration:
$ docker-compose exec rev wget -qO- localhost:8080/refresh --post-data=""
["logging.level.se.callista","service.defaultMaxMs","service.defaultMinMs"]
Make a new request:
$ curl -H "Authorization: Bearer $TOKEN" -ks 'https://localhost/api/product/12345' | jq .
Probably 30 sec has passed while we were reconfiguring the Review Service so the circuit breaker allows a request to see if the service is up again:
rev_1 | 2016-08-14 07:21:38.634 INFO [review-service,2a7ce13ae36ce0d,258cec0ffc5cf69d,false] 1 --- [ XNIO-2 task-24] s.c.m.core.review.service.ReviewService : /reviews called, processing time: 6
We will get a normal response and the circuit is closed, i.e. the system landscape is self healing:
  "reviews": [
    {
      "reviewId": 1,
      "author": "Author 1",
      "subject": "Subject 1"
    },
    ...
  ]
Also verify that the GetReviews circuit is Closed in the dashboard like:
Even if doing these tests are rather fun to perform the first time (personel preference…), they can be quite boring to repeat manually whenever you want to ensure that the microservice landscape is operational (e.g. as part of a CI/CD solution…)
Therefore I have written a small bash-script that automates parts of the tests above (left as an exercise for the interested reader to fill in more advanced tests :-)
The script will fist verify that all services are registered in Netflix Eureka, then get an Access Token from the OAuth server and finally call the composite service through the edge server.
Optionally, the script can also startup the system landscape using docker-compose before the tests are executed and shut it down again afterwards (controlled by adding the parameters start and stop).
Try it out with no containers up and running:
$ ./test-all.sh start stop
Fractions of the output will look like:
Start: Sun Aug 28 10:19:07 CEST 2016
Restarting the test environment...
$ docker-compose down
$ docker-compose up -d

Wait for: localhost:8761...
Wait for: localhost:8761/eureka/apps/config-server...

Get an OAuth Access Token:
ACCESS TOKEN: fabb3934-3d5e-42aa-b17e-f7ba1688f32e

Call API with Access Token...
Wait for API: ... Is the API awake?
$ curl -ks https://localhost:443/api/product/123 -H "Authorization: Bearer $TOKEN" | jq .
Ok

We are done, stopping the test environment...
$ docker-compose down
End: Sun Aug 28 10:20:43 CEST 2016
Afterwards all containers are removed, i.e. the test environment only existed during the execution of the automated end-to-end tests. Very useful, for example, in a CI/CD solution!
Ok, so we are back on track with updated versions of Docker, Spring Boot and Spring Cloud!
All the previously described functionality in earlier blog posts still works and we have added a fully automated end-to-end test script. We have also seen some new components in action like the Spring Cloud Configuration Server and Spring Cloud Sleuth. Actually Spring Cloud Stream is also new, but much harder to observe.
In the next blog posts in the Blog Series - Building Microservices we will cover the newly added components, Spring Cloud Configuration Server and Spring Cloud Sleuth. Eventually we will also cover the ELK stack that I promised a looong time ago, stay tuned…