Blogg
Här finns tekniska artiklar, presentationer och nyheter om arkitektur och systemutveckling. Håll dig uppdaterad, följ oss på Twitter
Här finns tekniska artiklar, presentationer och nyheter om arkitektur och systemutveckling. Håll dig uppdaterad, följ oss på Twitter

In this blog post we will add a Zipkin server to the system landscape in the blog series - Building Microservices, adding support for distributed tracing. We will also see how Spring Cloud Sleuth can simplify both creation of trace events and sending them to the Zipkin server.
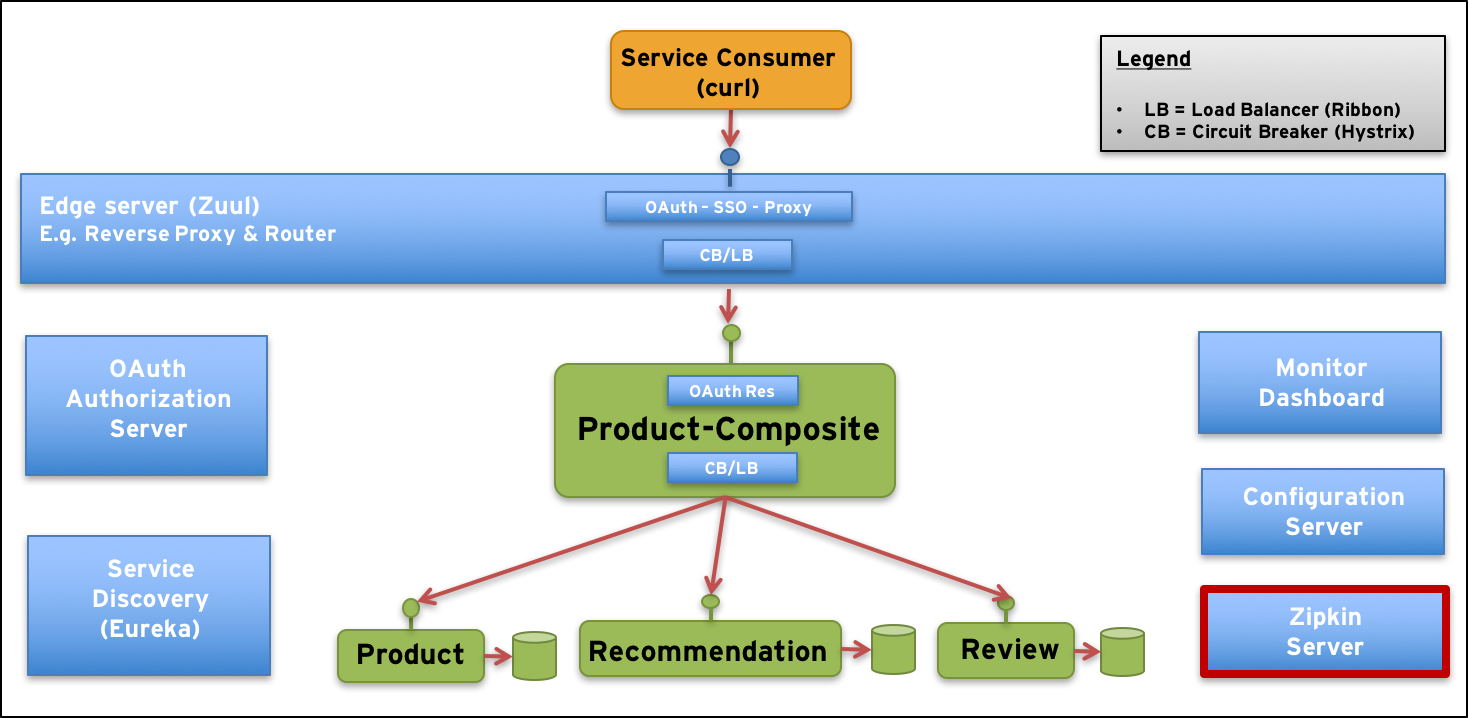
The more cooperating microservices we get in our system landscape, the harder it gets to understand what’s going on. Specifically, when the load increase and response times starts to get slower than expected…
To get a better understanding of what is going on we need to be able to trace a request as it pass through a number of cooperating microservices and measure the processing time in each microservice that is involved in responding to the request.
The trace events for one request must be collected, grouped together and presented in an understandable way. This is exactly what Zipkin is about!
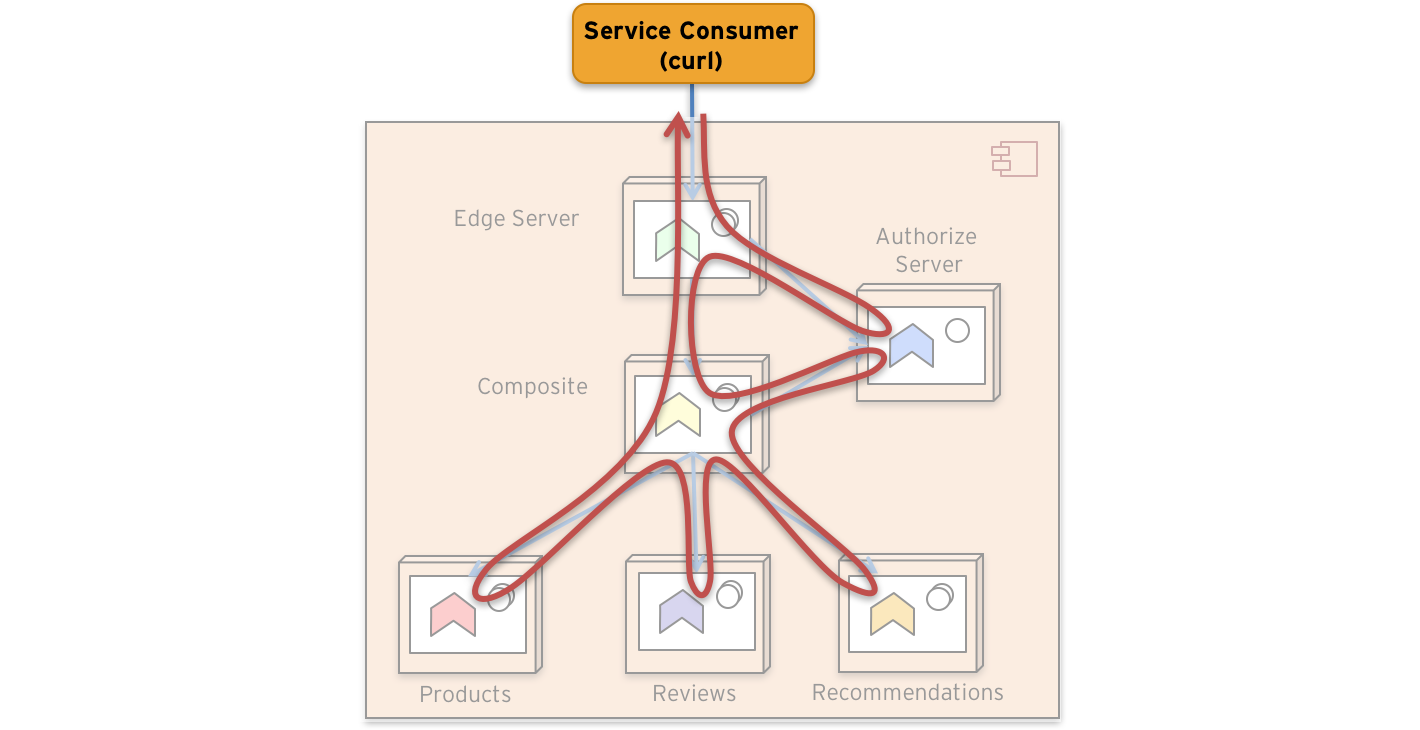
A request through our system landscape can be visualized as:
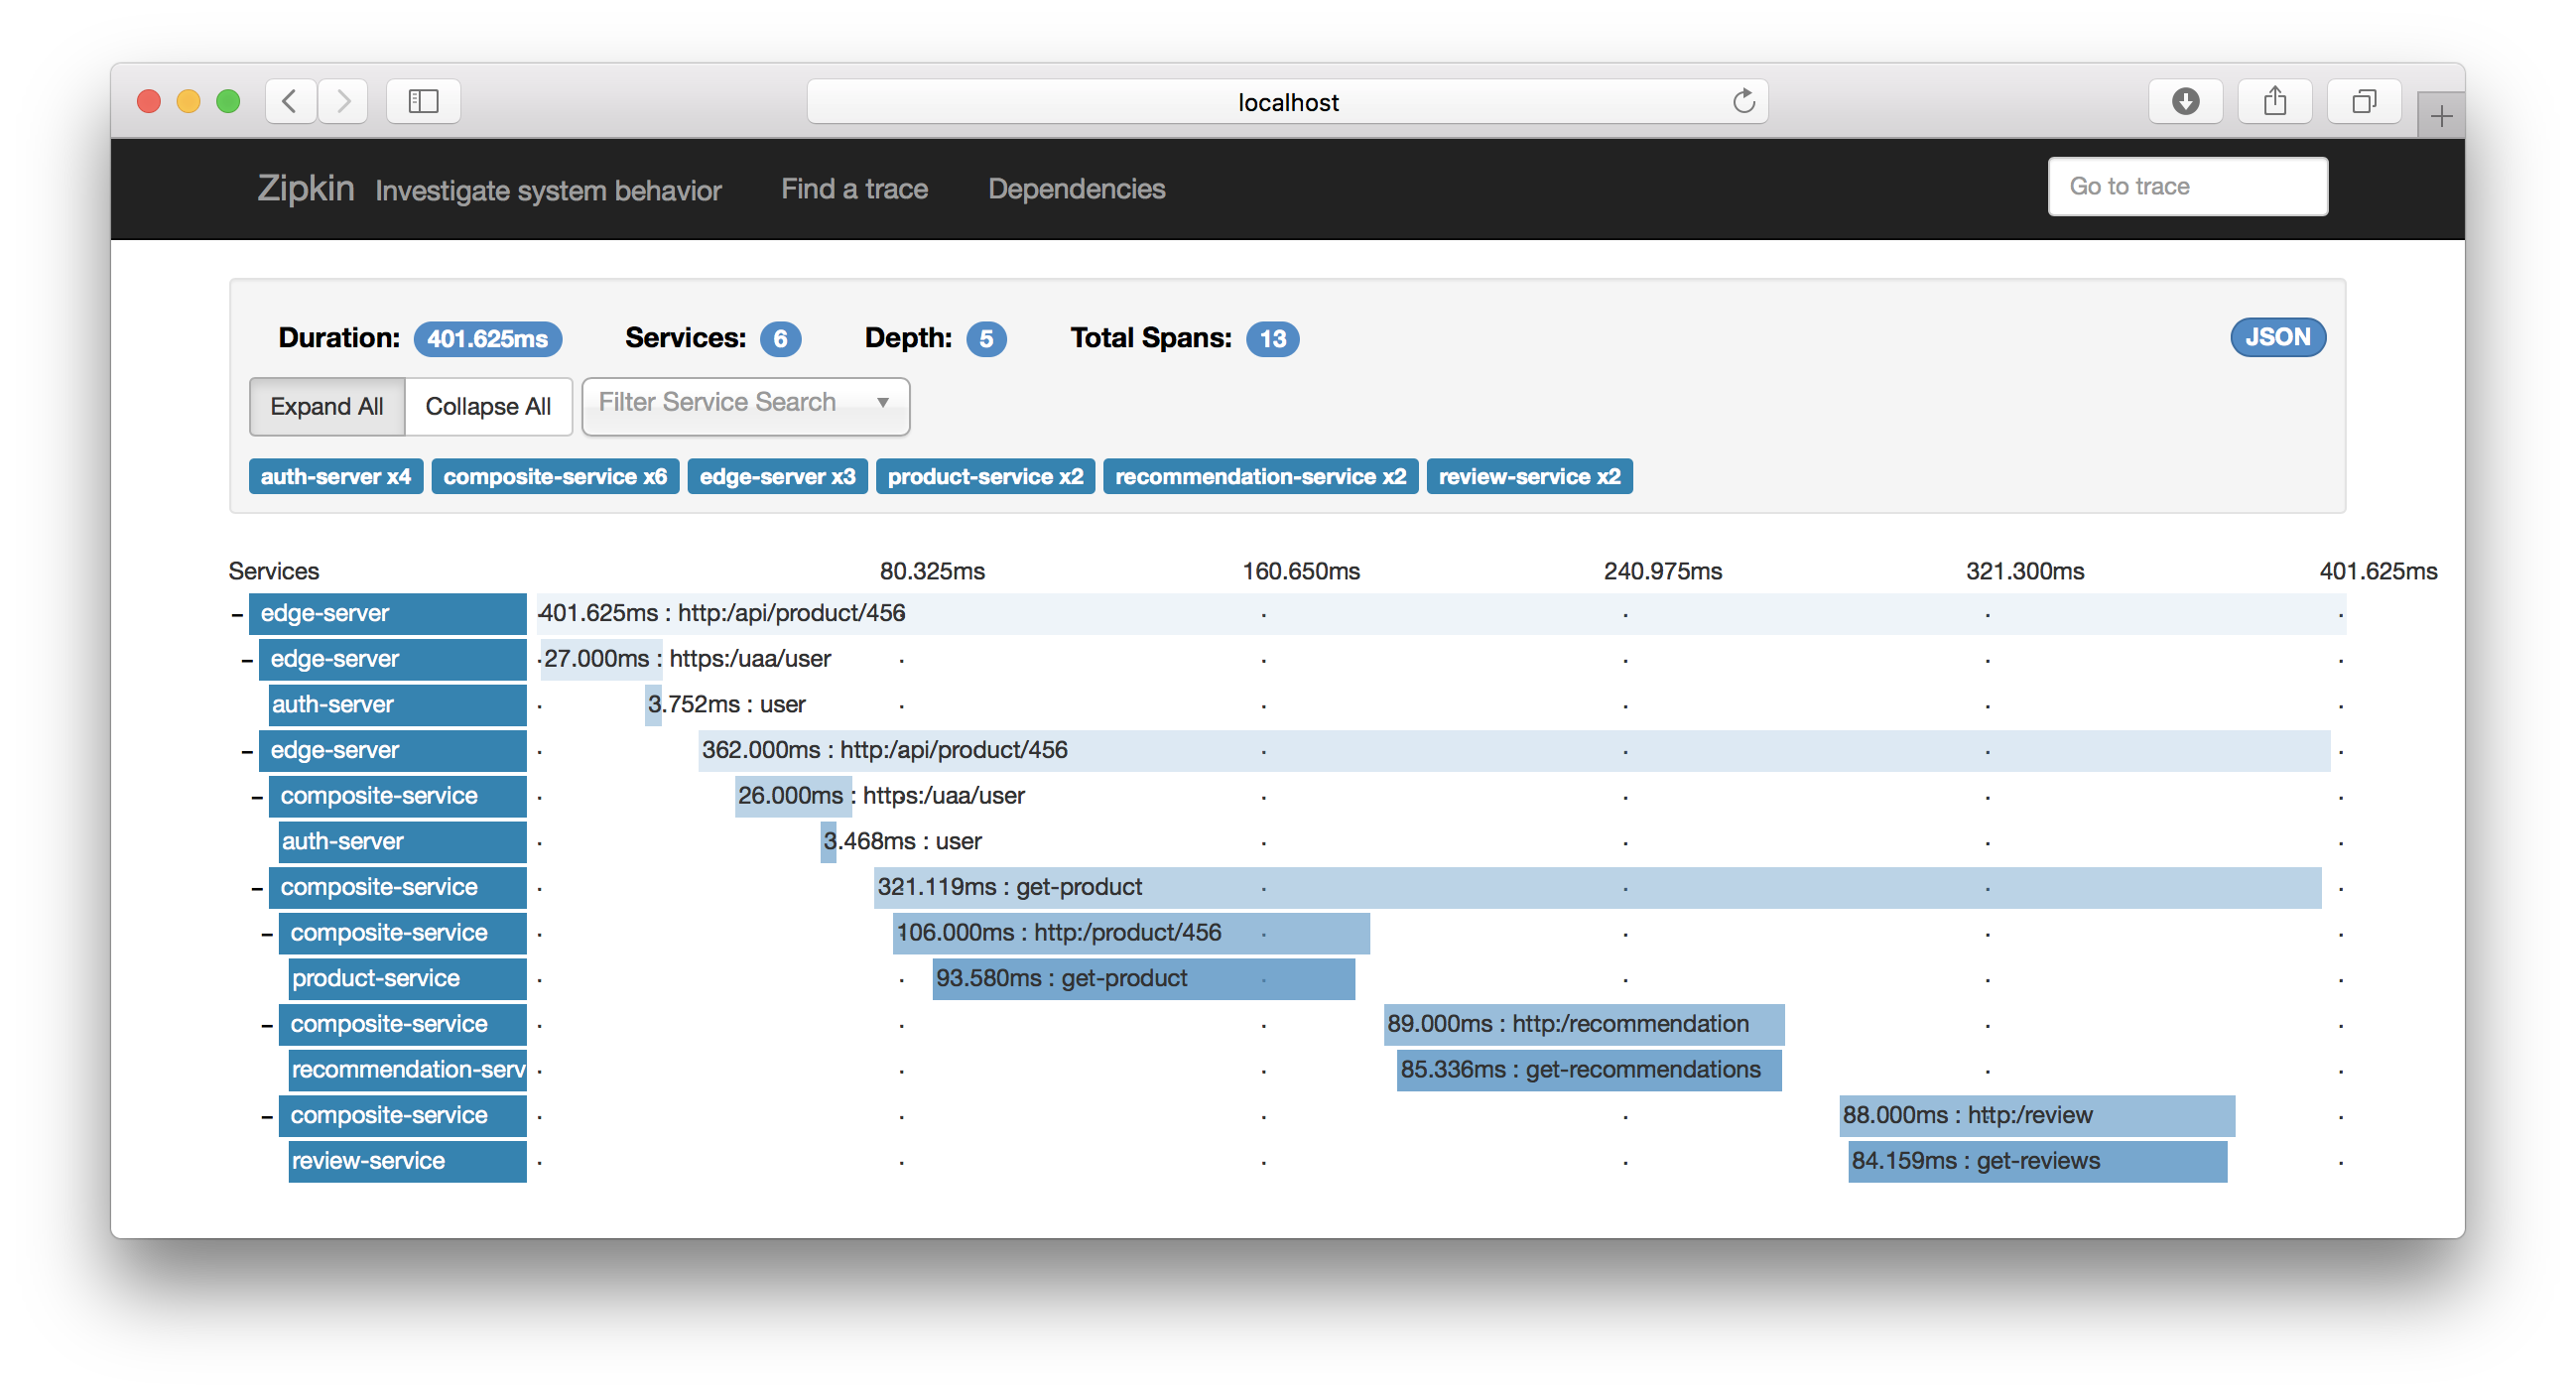
Zipkin can visualize the processing time in each involved microservice for a sample request as:
Zipkin originates from Twitter (see the blog post Distributed Systems Tracing with Zipkin) and lives today as an open source project in GitHub.
The terminology used by Zipkin is based on a paper written by Google: Dapper, a Large-Scale Distributed Systems Tracing Infrastructure.
Spring Cloud Sleuth can be used by microservices developed using Spring Cloud, to simplify both creation of trace events and sending them to the Zipkin server.
A trace represents the whole processing of a request. A span represents the processing that takes part in each individual microservice, as a step in the processing of a request. All trace events from processing a request share a common unique Trace Id. Each individual processing step, i.e. a span, is given a unique Span Id.
For further explanation of traces and spans see the Spring Cloud Sleuth documentation regarding terminology.
Spring Cloud Sleuth intercepts incoming requests and either picks up the trace id from the incoming message or creates a new trace id if none was specified. For outgoing requests, it fills in the current trace id in the outgoing message. Both synchronous requests and asynchronous messages are supported, using HTTP for synchronous request and a Spring Cloud Stream binder (e.g. RabbitMQ) for asynchronous messages.
Spring Cloud Sleuth also:
Setting up a Zipkin server is straight forward, similar to how you setup the other Spring Cloud servers, e.g. a Discovery, Edge or Configuration server:
The Gradle dependencies that enables the Spring Boot application to be a Zipkin server are:
 compile "org.springframework.cloud:spring-cloud-sleuth-zipkin-stream"
 compile "org.springframework.cloud:spring-cloud-starter-sleuth"
 compile "org.springframework.cloud:spring-cloud-stream-binder-rabbit"
 runtime('io.zipkin.java:zipkin-autoconfigure-ui')
Note: The
-stream-suffix on thespring-cloud-sleuth-zipkin-streamdependency enables the Zipkin server to receive trace events using an event bus based onspring-cloud-stream. The dependencyspring-cloud-stream-binder-rabbitbinds the Zipkin server to use RabbitMQ as event bus.
The server only contains a single Java class: ZipkinServerApplication and the only thing of interest in it is the following annotations on its static main - method:
 @SpringBootApplication
 @EnableZipkinStreamServer
@SpringBootApplication is, as usual, what makes our application a Spring Boot application.
@EnableZipkinStreamServer is what makes it a Zipkin server that is able to:
1. Receive trace events synchronously over HTTP
2. Receive trace events asynchronously over Spring Cloud Stream
3. Present a Web based UI for searching trace events manually
4. Present a RESTful and JSON-based API for searching trace events programmatically
5. Store trace events in memory
Note: It is possible to configure a Zipkin server to store the trace events in a database, e.g. MySQL or Elasticsearch.
That’s not bad for a single annotation, right?
The source code of the Zipkin server also contains:
Standard configuration files
Note: The Zipkin server does not use the Configuration server at this time, to be fixed in a future blog post :-)
An empty integration test class, that verifies that the Zipkin server can start
A conventional Dockerfile
For further details see the folder blog-microservices/microservices/support/zipkin-server in the source code.
To enable our microservices to send trace events to the Zipkin server we have added the following dependencies in our Gradle build files:
compile('org.springframework.cloud:spring-cloud-starter-sleuth')
compile('org.springframework.cloud:spring-cloud-sleuth-stream')
These dependencies will enable our microservices to stream tracing events asynchronously to the Zipkin server over the event bus.
To ensure that we send all trace messages to the Zipkin server we have added the following configuration to the common config file, application.yml, in the config repo:
# 1.0 means 100%, see http://cloud.spring.io/spring-cloud-sleuth/spring-cloud-sleuth.html#_sampling
spring.sleuth.sampler.percentage: 1.0
Note #1: To promote loose coupling we prefer sending trace events to the Zipkin server asynchronously over the event bus instead of sending events synchronously using HTTP directly to the Zipkin server.
Note #2: From earlier blog posts we already have dependencies and configuration in place that binds the microservices to use RabbitMQ as the event bus.
Note #3: A system with high traffic volumes can produce large amounts of trace events. It might be sufficient to only collect some of the events to understand what is going on. This can be achieved by lowering the value of the property
spring.sleuth.sampler.percentage.Note #4: The name of the microservices in the trace events are taken from the property
spring.application.namein each microservice localbootstrap.yml- file.
A final note on use of Spring’s RestTemplate: To make it possible for Spring Cloud Sleuth to add tracing headers to the outgoing requests it is important that the RestTemplate is injected and not created directly in the code, e.g. not using new RestTemplate().
For a correct usage see ProductCompositeIntegration.java:
private final ServiceUtils util;
private final RestOperations restTemplate;

@Inject
public ProductCompositeIntegration(ServiceUtils util, RestOperations restTemplate) {
    this.util = util;
    this.restTemplate = restTemplate;
}
For details on how to build and run the microservice landscape in this blog post series, see the blog post #5.
Note: To be able to run some of the commands used below you need to have the tools cURL and jq installed.
In summary:
Open a terminal, create a folder of your choice and cd into it:
 $ mkdir a-folder-of-your-choice
 $ cd a-folder-of-your-choice
Since we have externalized our configuration into a configuration repository we first need to get it from GitHub:
$ git clone https://github.com/callistaenterprise/blog-microservices-config.git
Next, we get the source code from GitHub and checkout the branch used for this blog post:
 $ git clone https://github.com/callistaenterprise/blog-microservices.git
 $ cd blog-microservices
 $ git checkout -b B10.1 M10.1
Now we can build our microservices with:
$ ./build-all.sh
Finally, we can bring up the dockerized microservice landscape and run a test:
$ . ./test-all.sh start
After a while, it should result in a response from the API request like:
 $ curl -ks https://localhost:443/api/product/123 -H "Authorization: Bearer $TOKEN" | jq .
 {
   "productId": 123,
   "name": "name",
   "weight": 123,
   "recommendations": [	...  ],
   "reviews": [ ... ],
   "serviceAddresses": { ... }
 }
Note #1: We will not shut down the microservice landscape (can be done by adding the parameter:
stop). Below we will use it to try out the Zipkin server.
Note #2: The first
.in the command above is essential. It allows us to reuse theTOKENenvironment variable that the script creates to store an OAuth Access Token, i.e. we don’t need to acquire one ourselves.
Try a manual call like:
 $ curl -ks https://localhost/api/product/123 -H "Authorization: Bearer $TOKEN" | jq .
 {
   "productId": 123,
   "name": "name",
   "weight": 123,
   "recommendations": [	...  ],
   "reviews": [ ... ],
   "serviceAddresses": { ... }
 }
Before we start to test Zipkin let’s inspect a log event a bit closer, e.g.:
composite_1 | 2017-07-17 07:27:28.678 INFO [composite-service,8f79b9c84065ccd8,529909c553bfed03,true] 1 --- [ XNIO-2 task-9] o.s.b.a.s.o.r.UserInfoTokenServices : Getting user info from: https://auth:9999/uaa/user
Note: You can see you log events with the command:
docker-compose logs -f
The part [composite-service,8f79b9c84065ccd8,529909c553bfed03,true] comes from Spring Cloud Sleuth with the following information:
The name of the component, e.g. composite-service
Taken from the spring.application.name - property as described above.
The trace id, e.g. 8f79b9c84065ccd8
If you search for a trace id in the log output you will find all log events from the involved microservices related to the processing of one request.
529909c553bfed03.Note: The id of the first span in the processing of a request, known as the root span, is used as the trace id.
truetrue indicates that the span will be reported to Zipkin.Now, make some calls to the microservice landscape:
$ curl -k -H "Authorization: Bearer $TOKEN" https://localhost/api/product/456
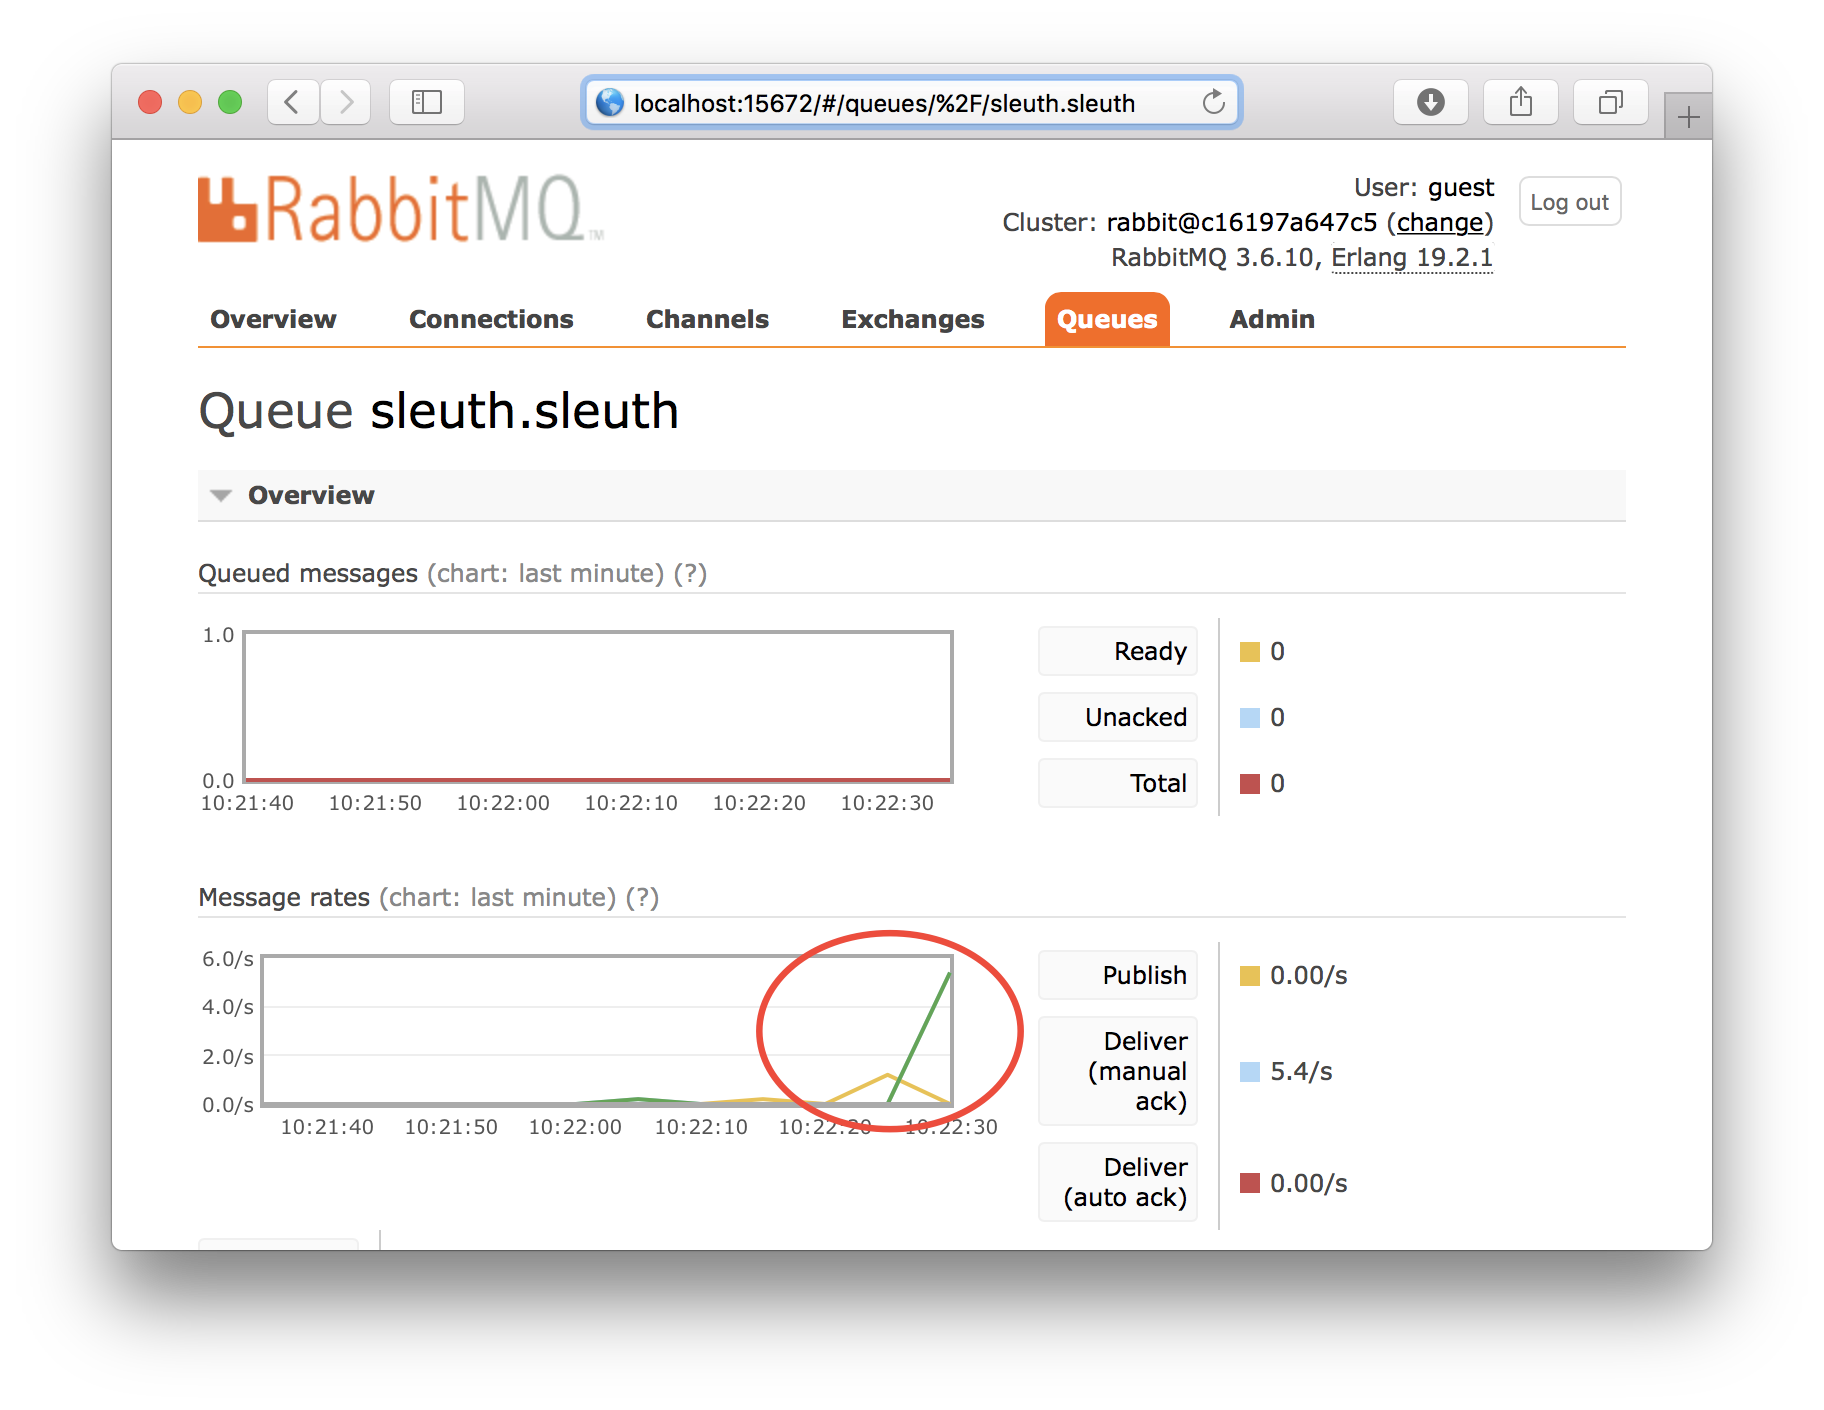
Let’s first take a quick look into RabbitMQ to verify that trace events are sent to the Zipkin server (using the exchange sleuth and the queue sleuth.sleuth). Open the URL http://localhost:15672/#/queues/%2F/sleuth.sleuth in your web browser and log in using guest/guest and you should see something like:
Now open the Zipkin Web UI in your web browser: http://localhost:9411:
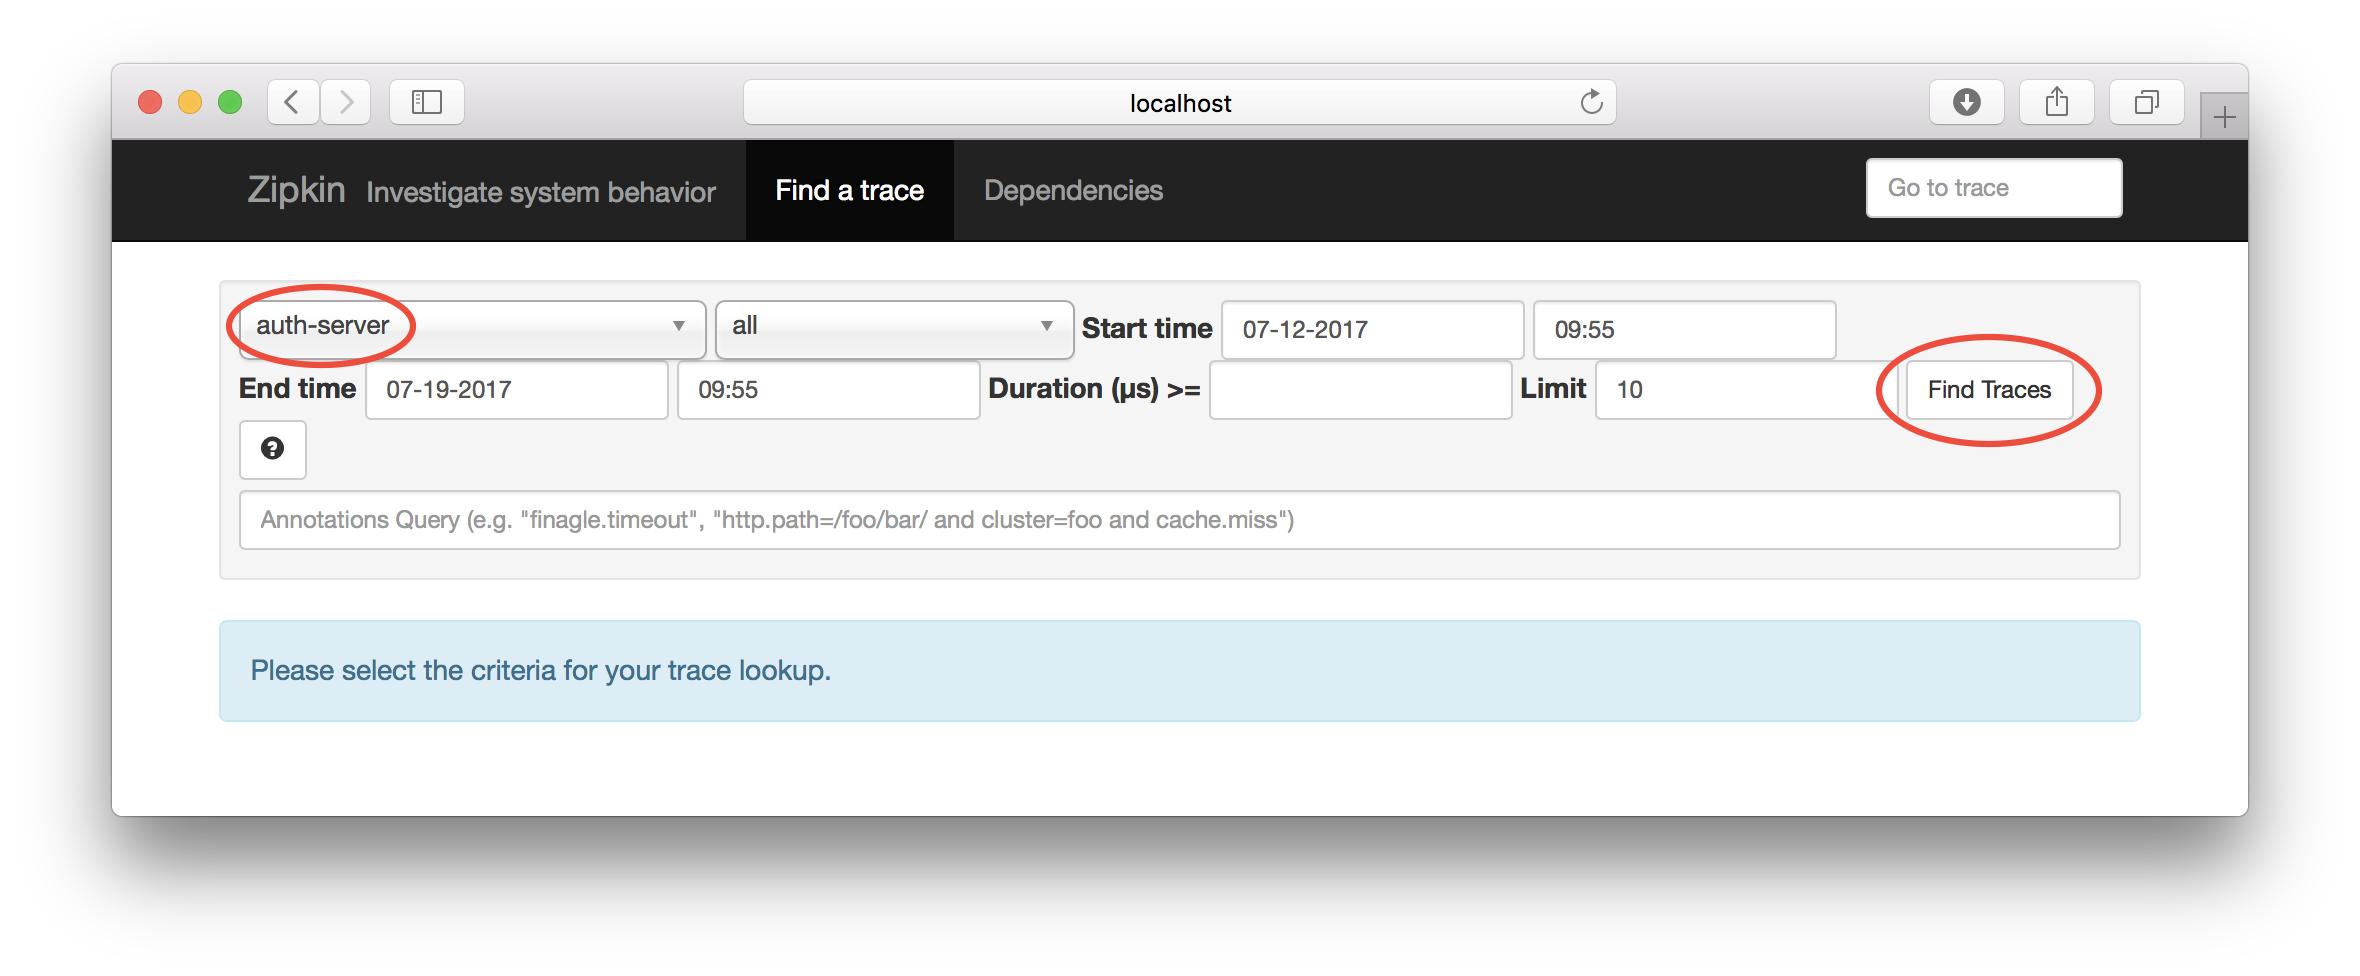
Select the edge-server and ensure that you have set a proper time interval and click on the “Find Trace” - button:
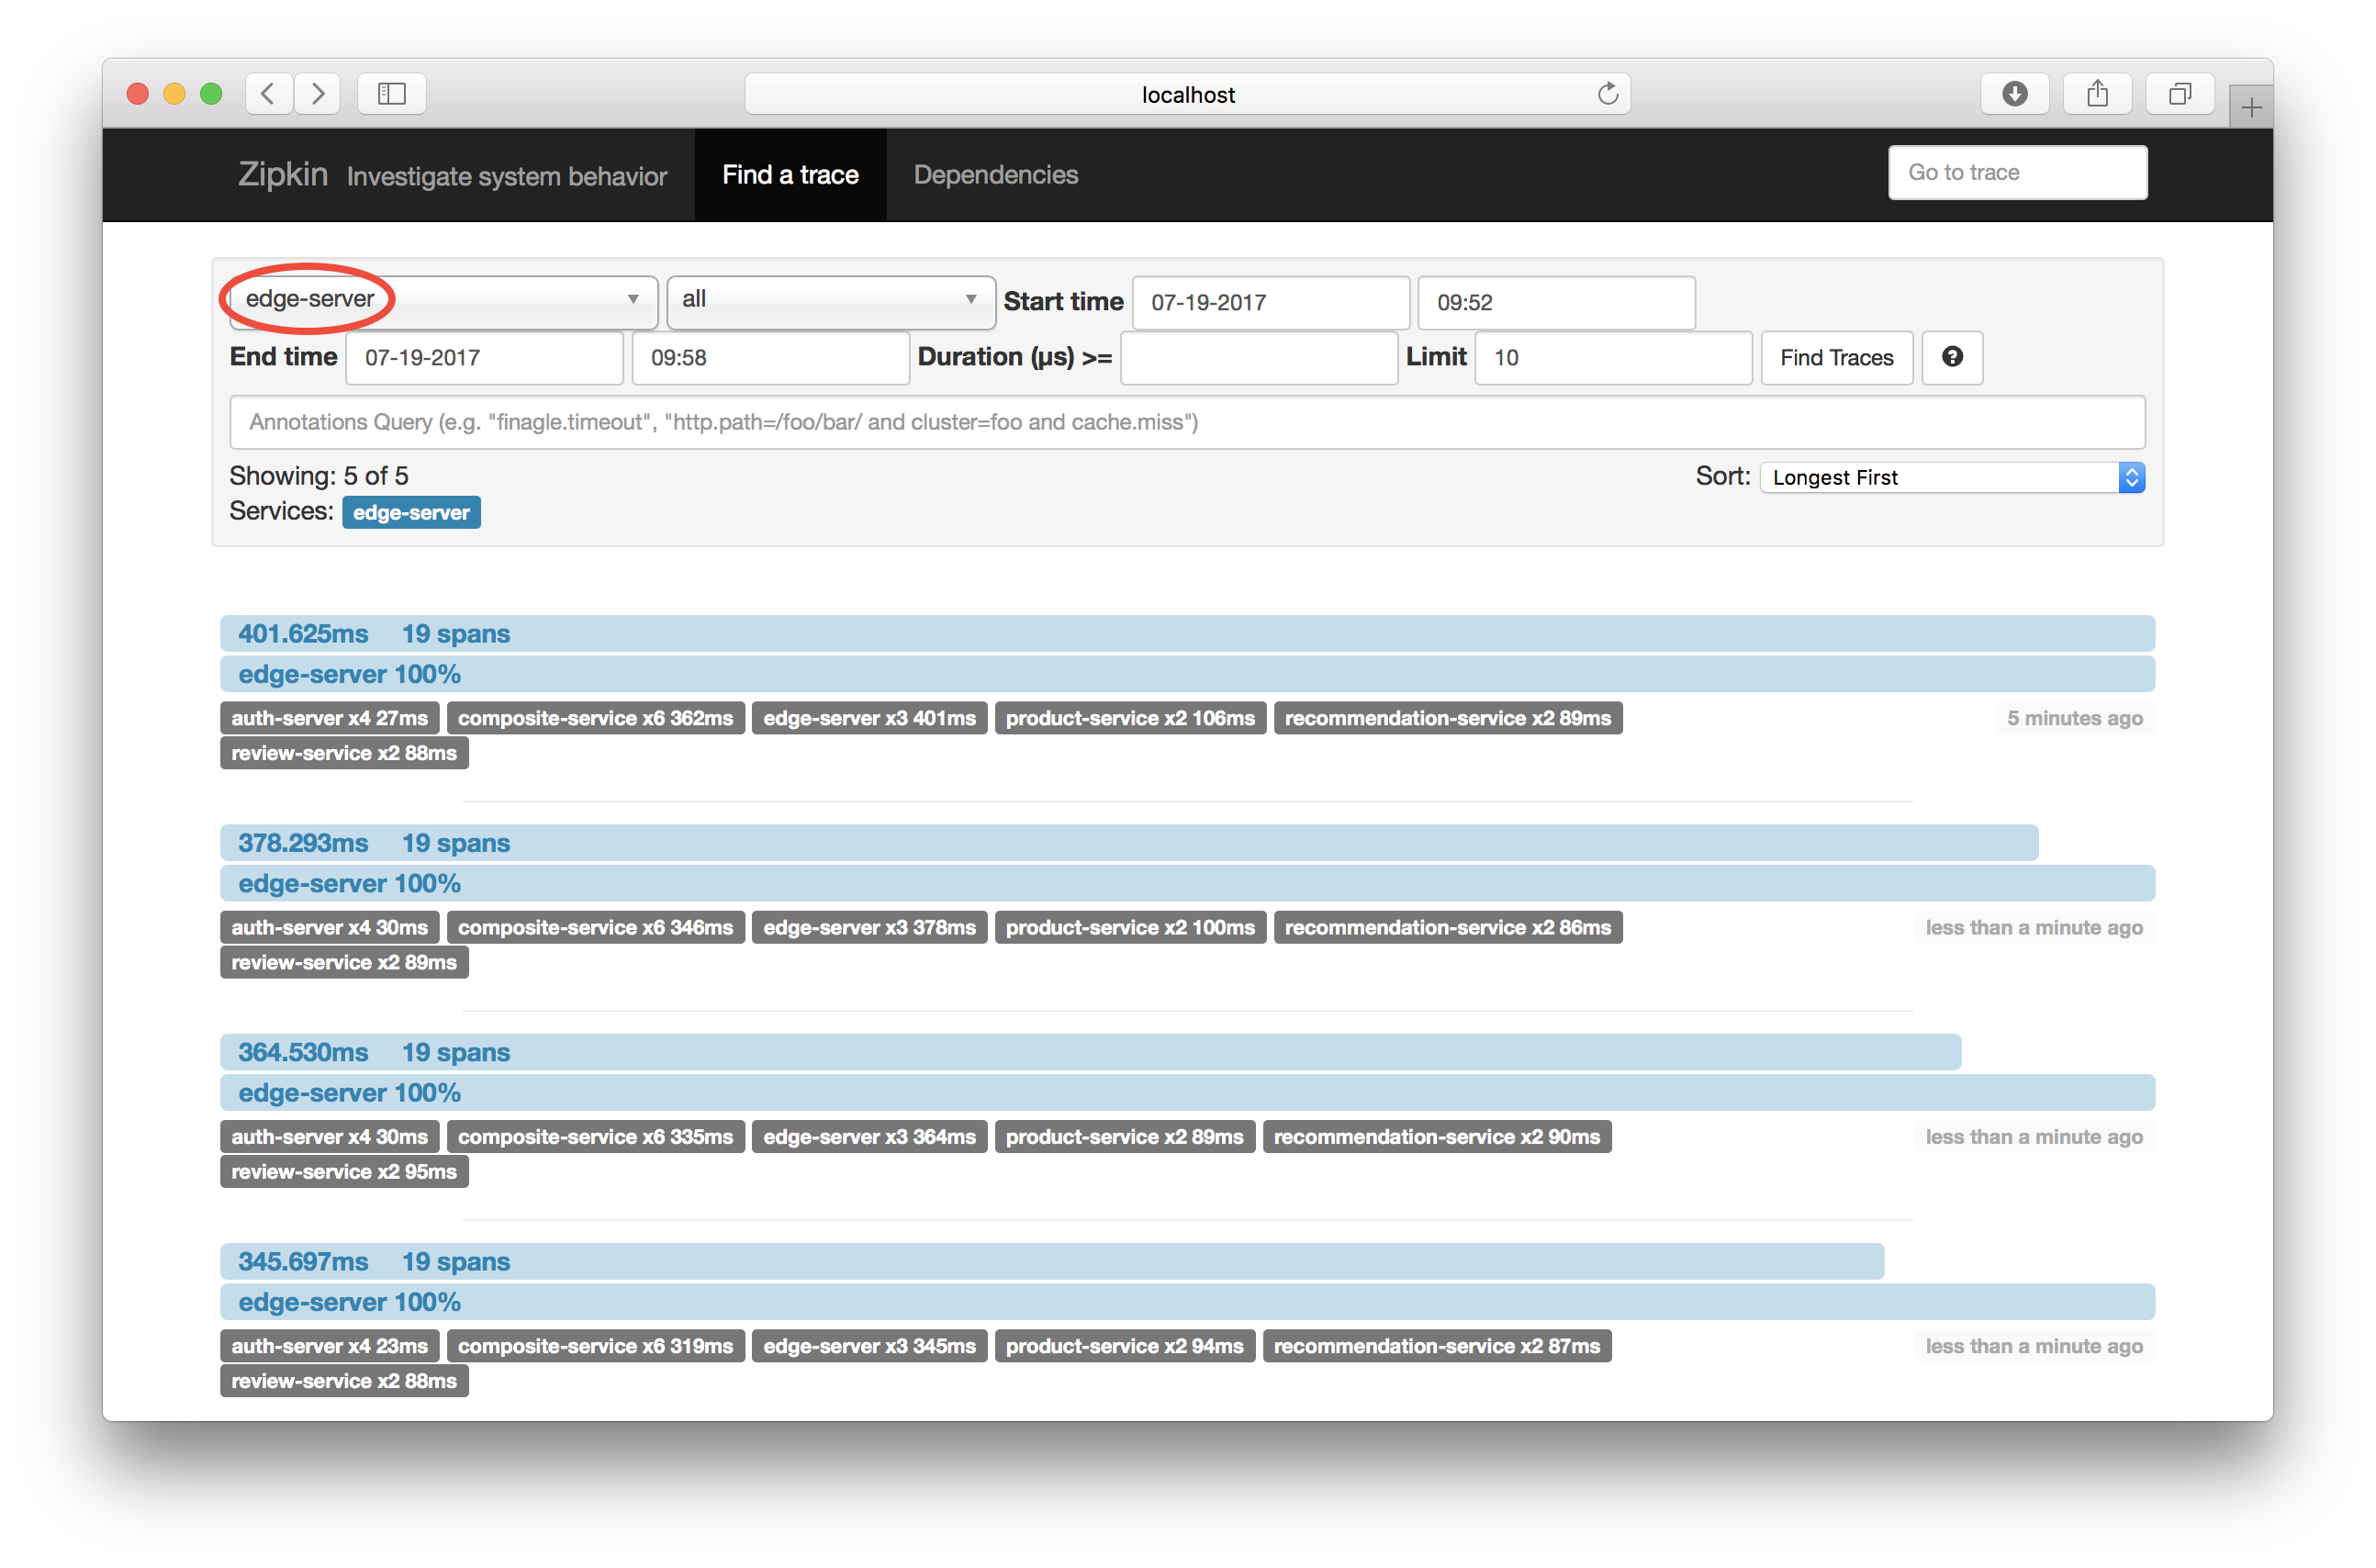
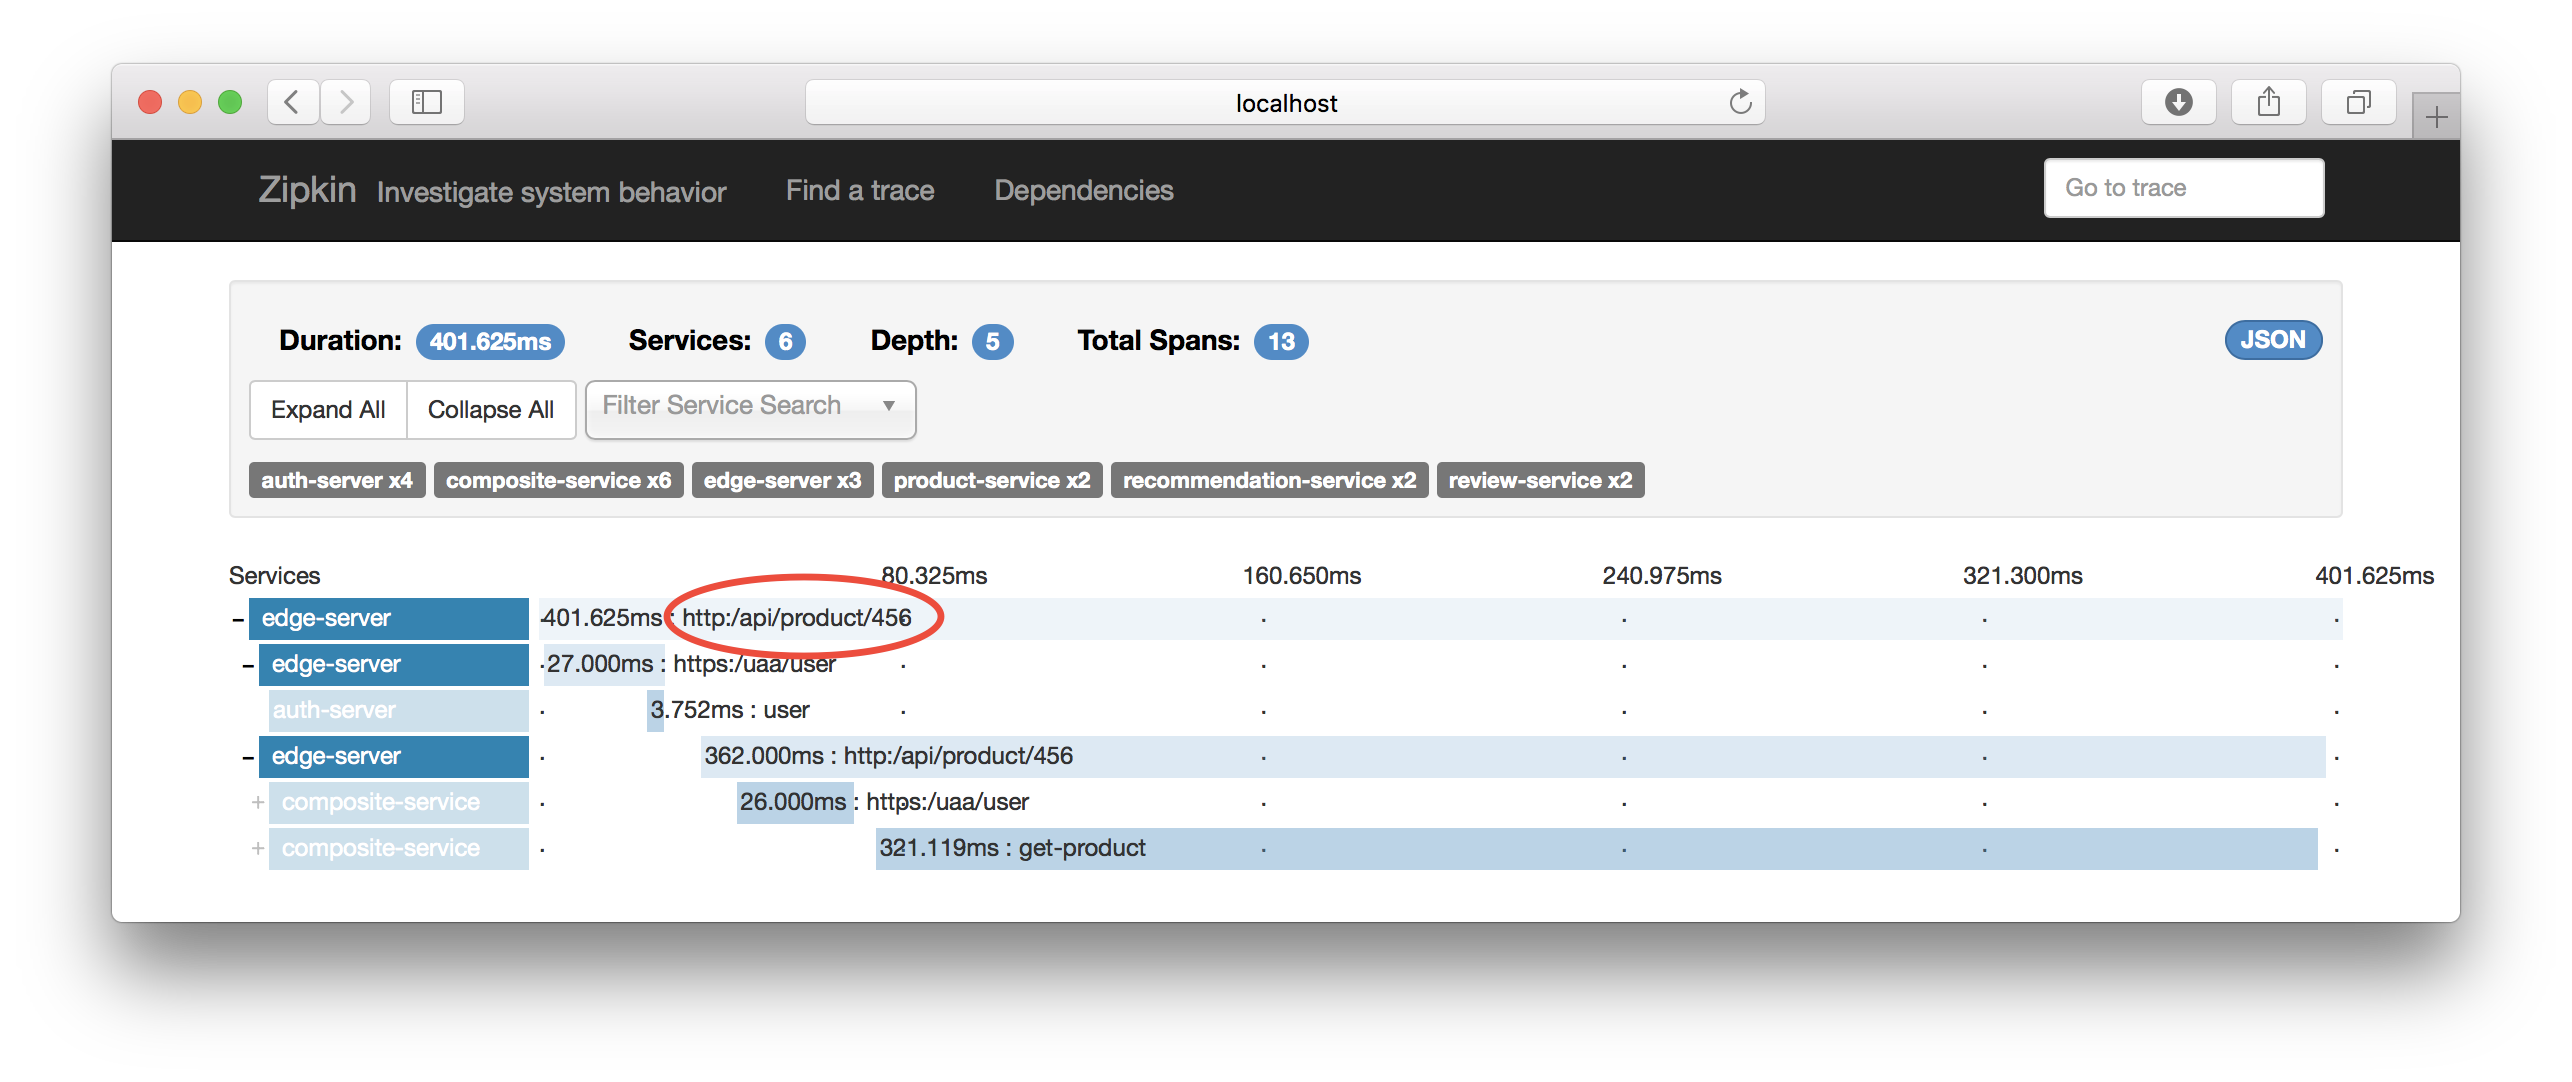
A number of traces are displayed. If you click on one of them it will expand and show something like:
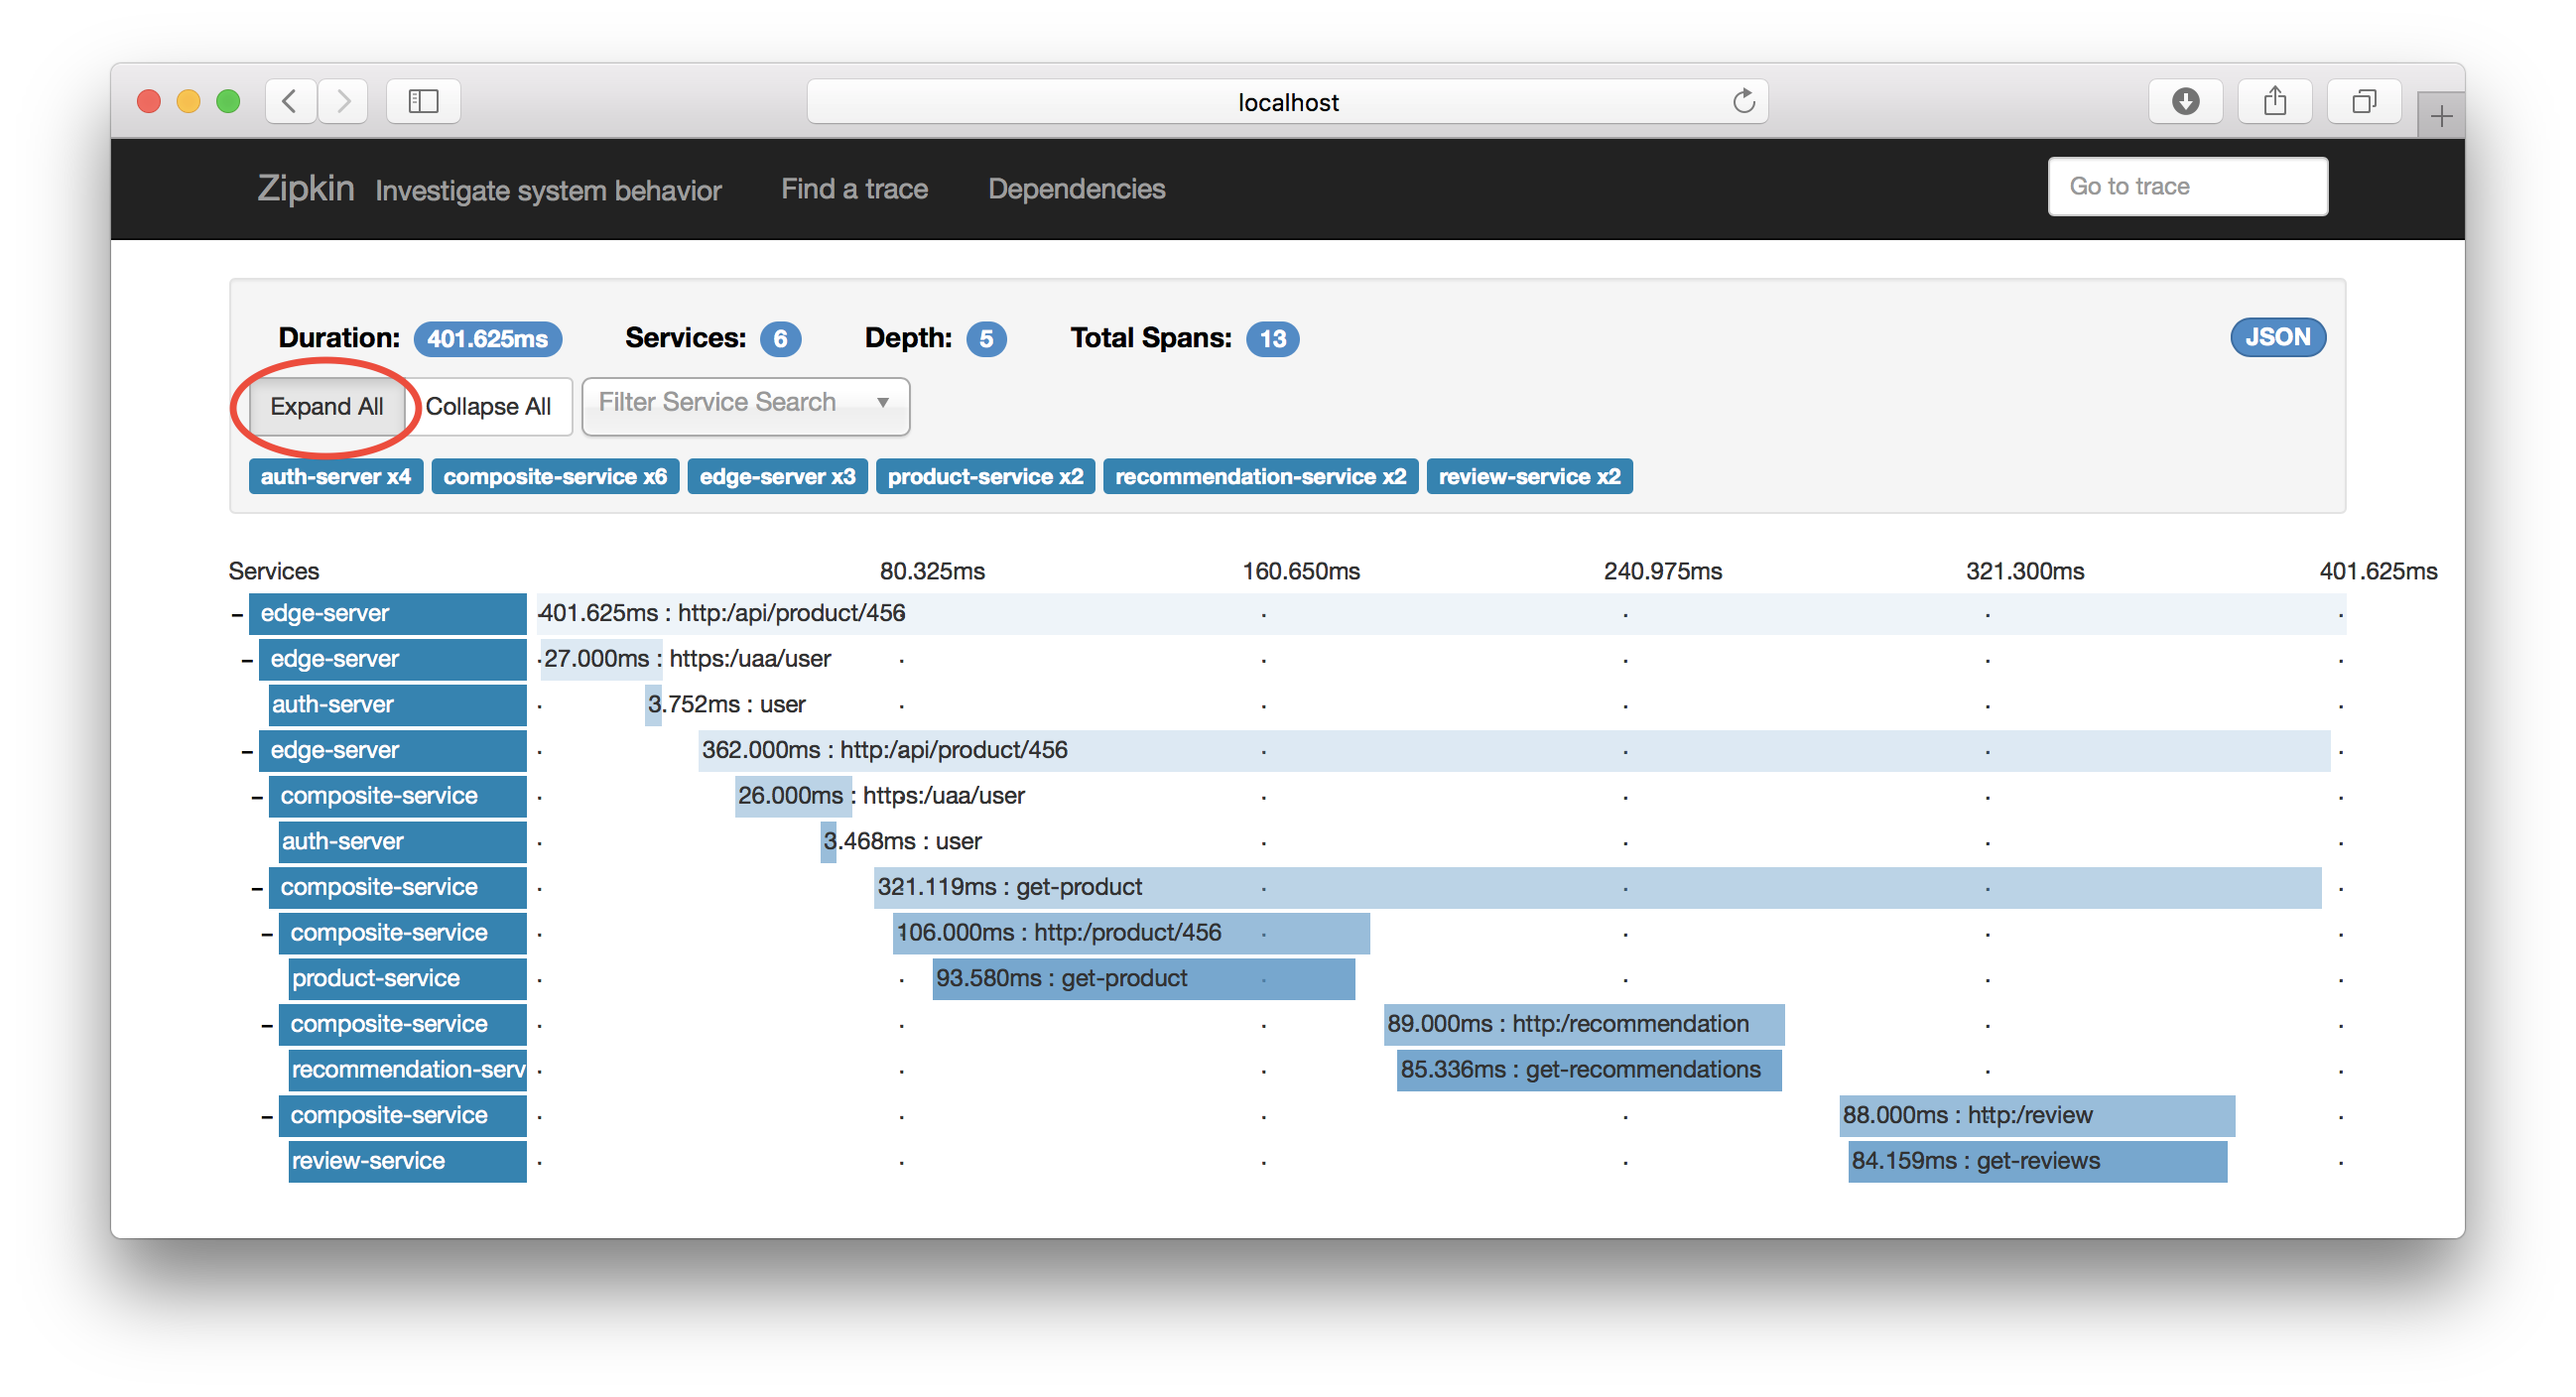
Hint: Click on the “Expand All” button to see the complete call graph.
I guess the graph is self explanatory :-)
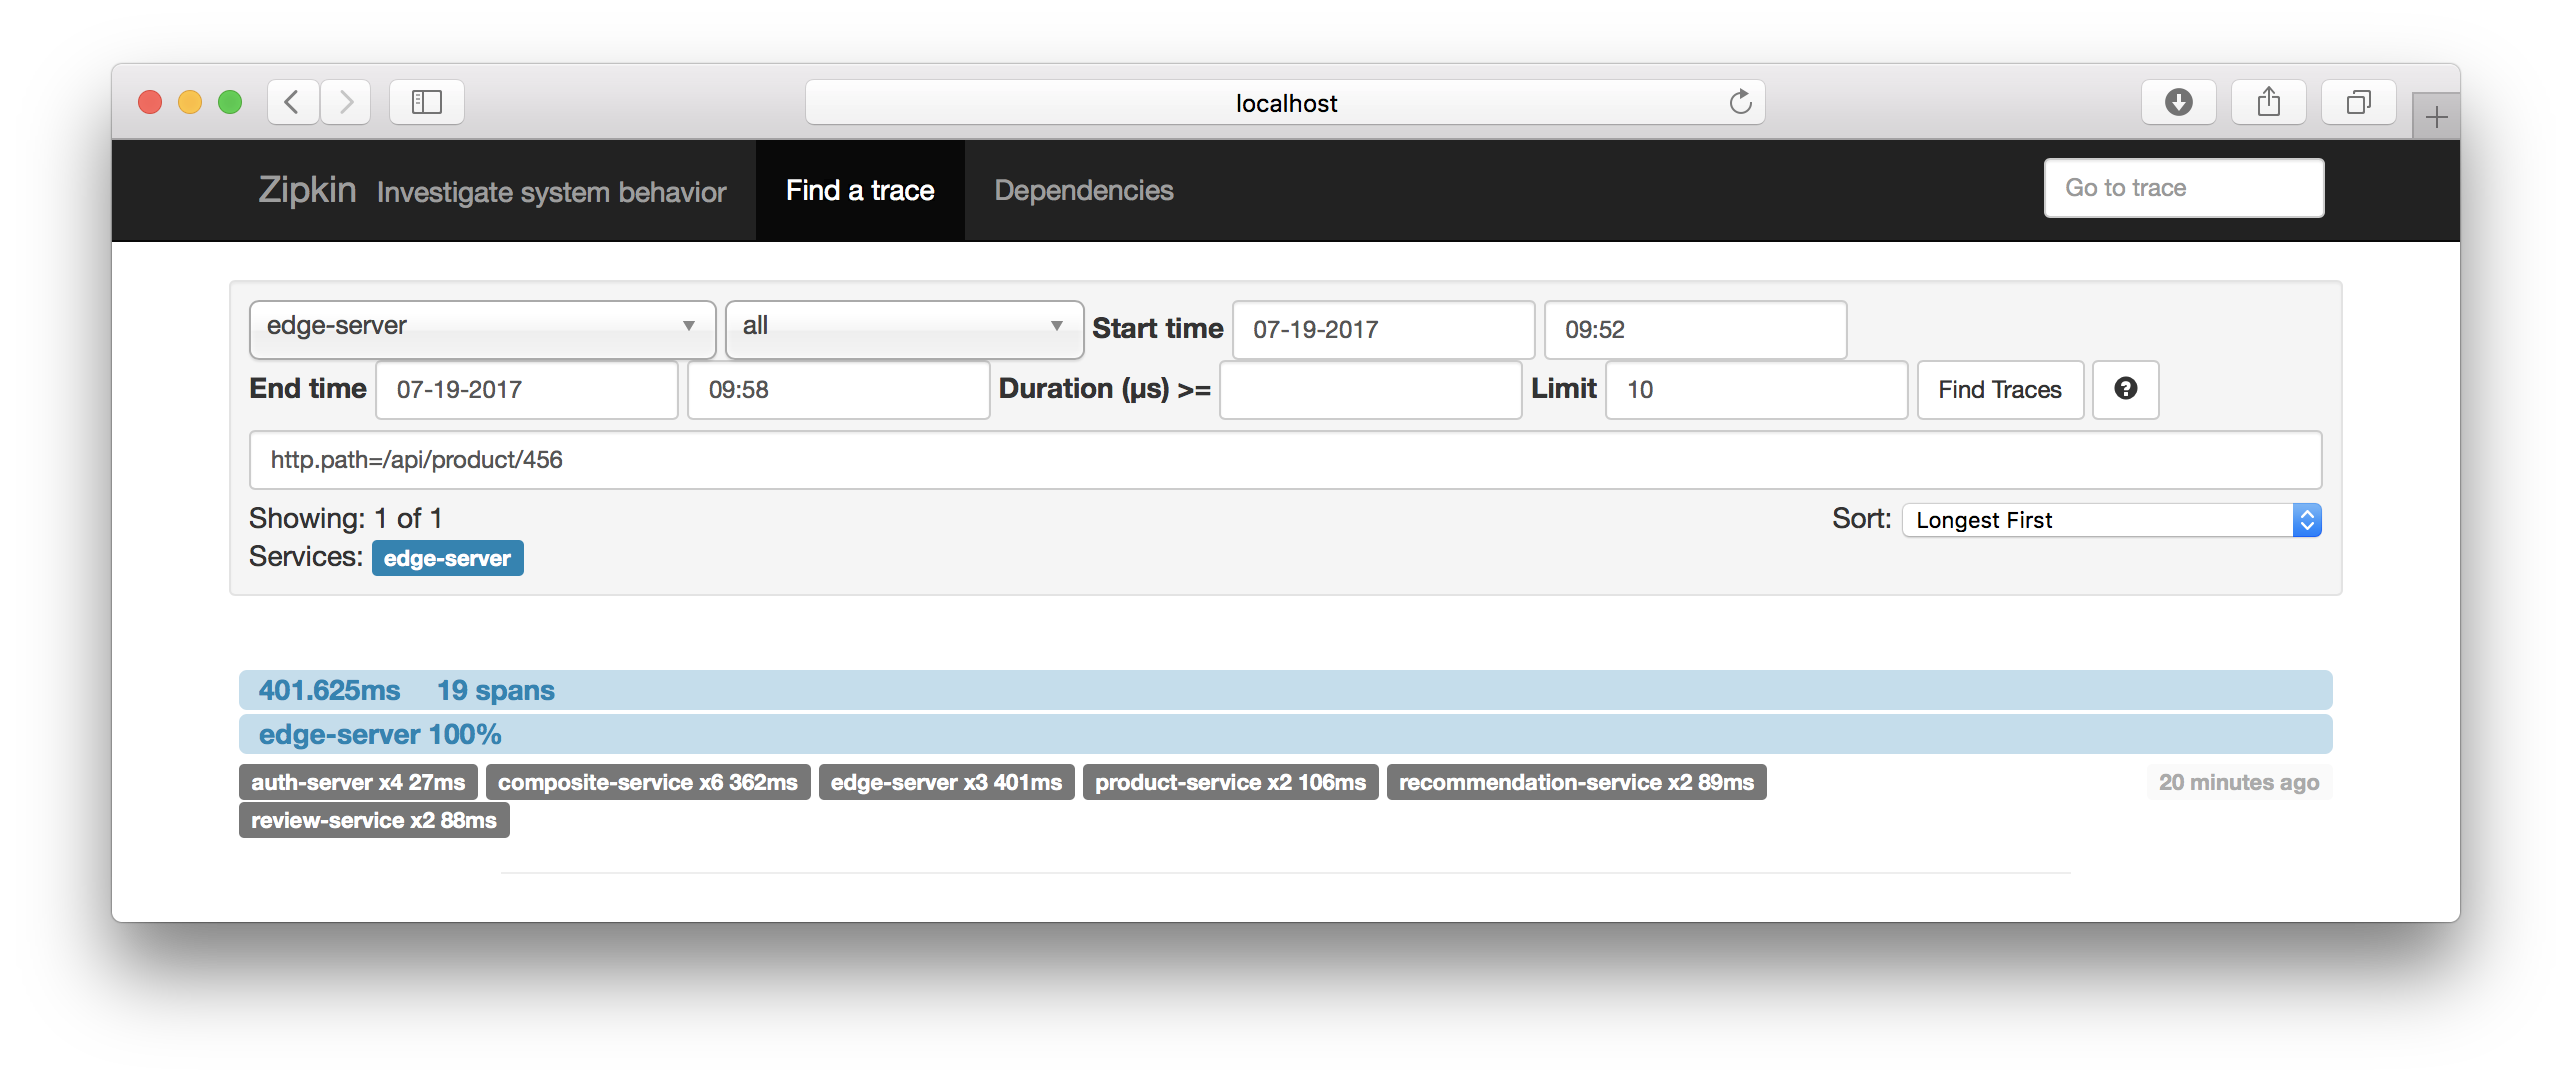
To find a specific request you can use the query field to specify the HTTP request URI (e.g. assuming it is known from examine the log output)
Go back to the initial search dialog an enter http.path=/api/product/456 in the query field:
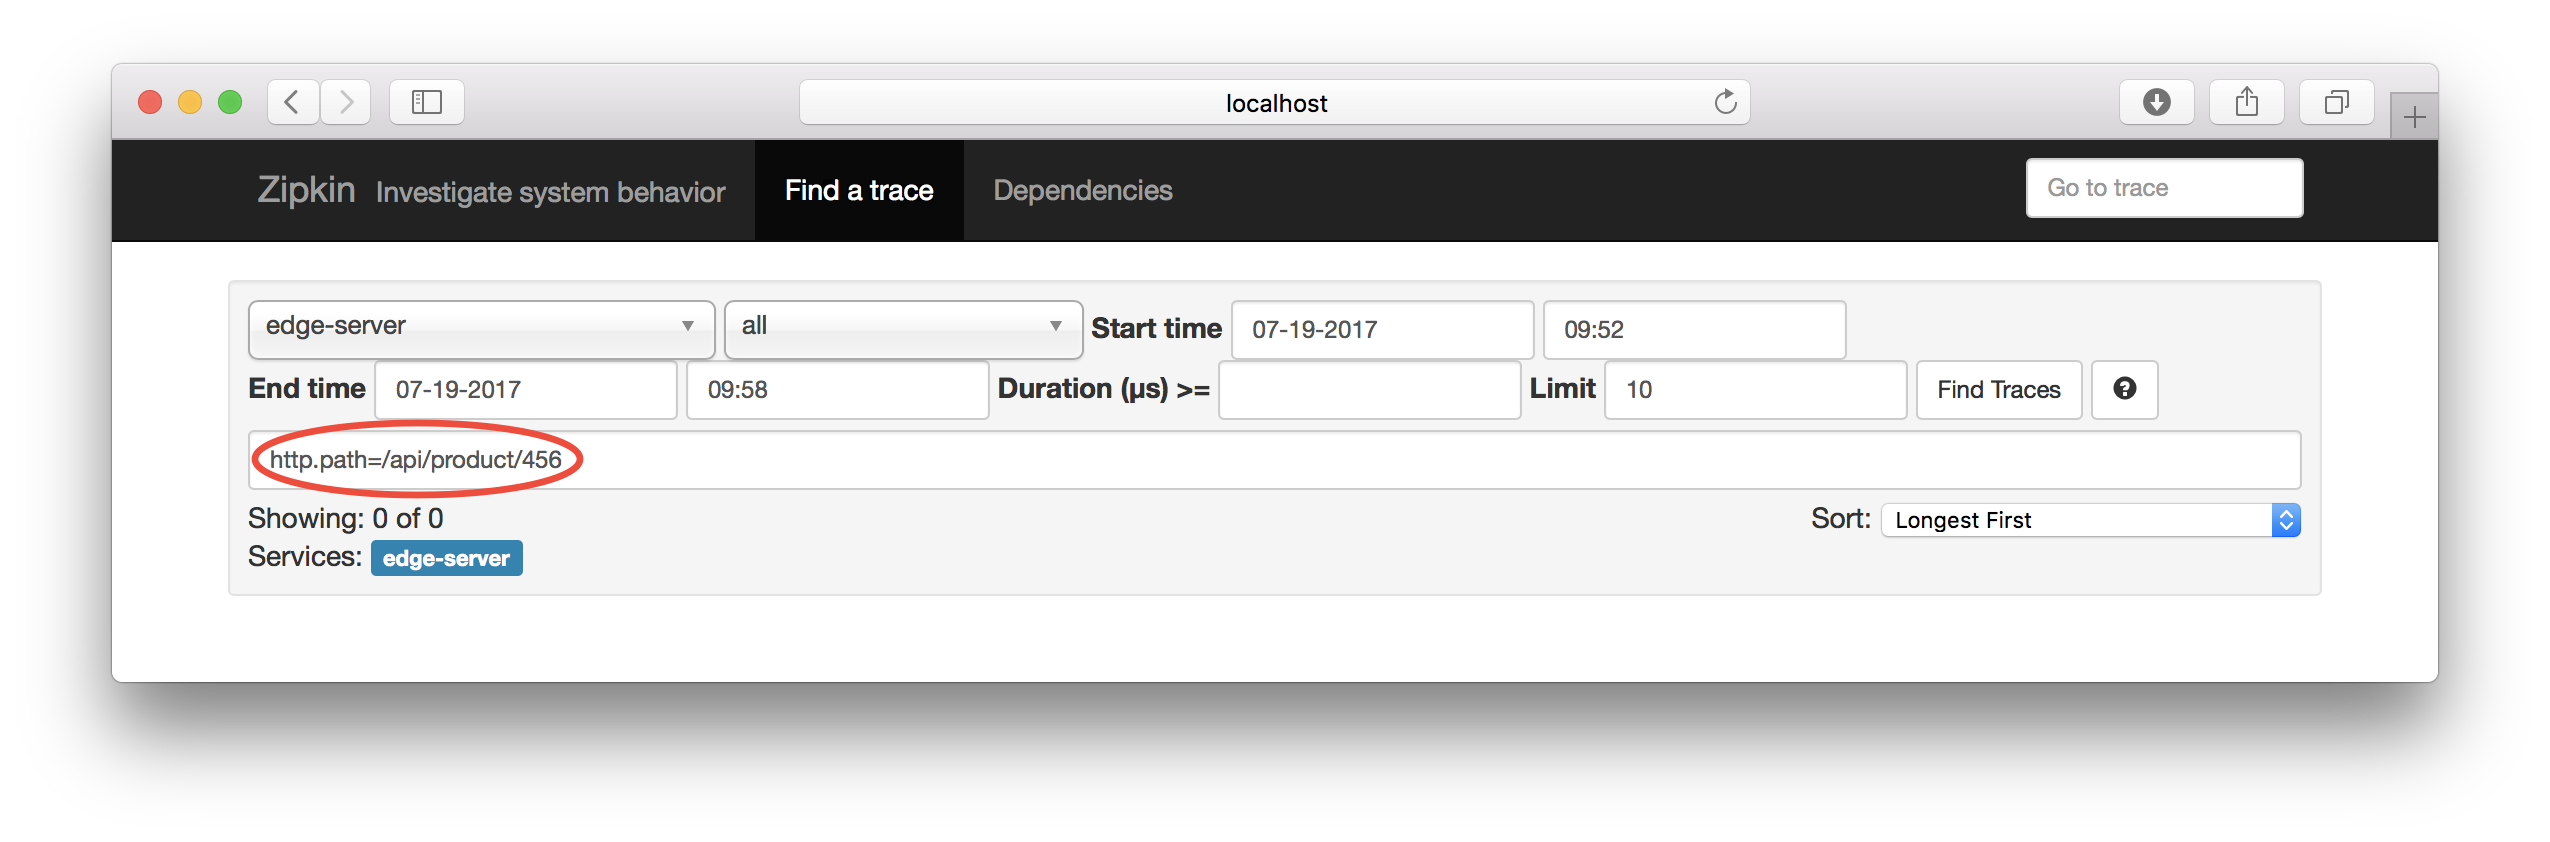
Click on the “Find Trace” - button and you should see traces that match the query you entered:
Click on one of the matched traces and verify that the HTTP request URI matches:
Also try out clicking on the “Dependencies” tab:
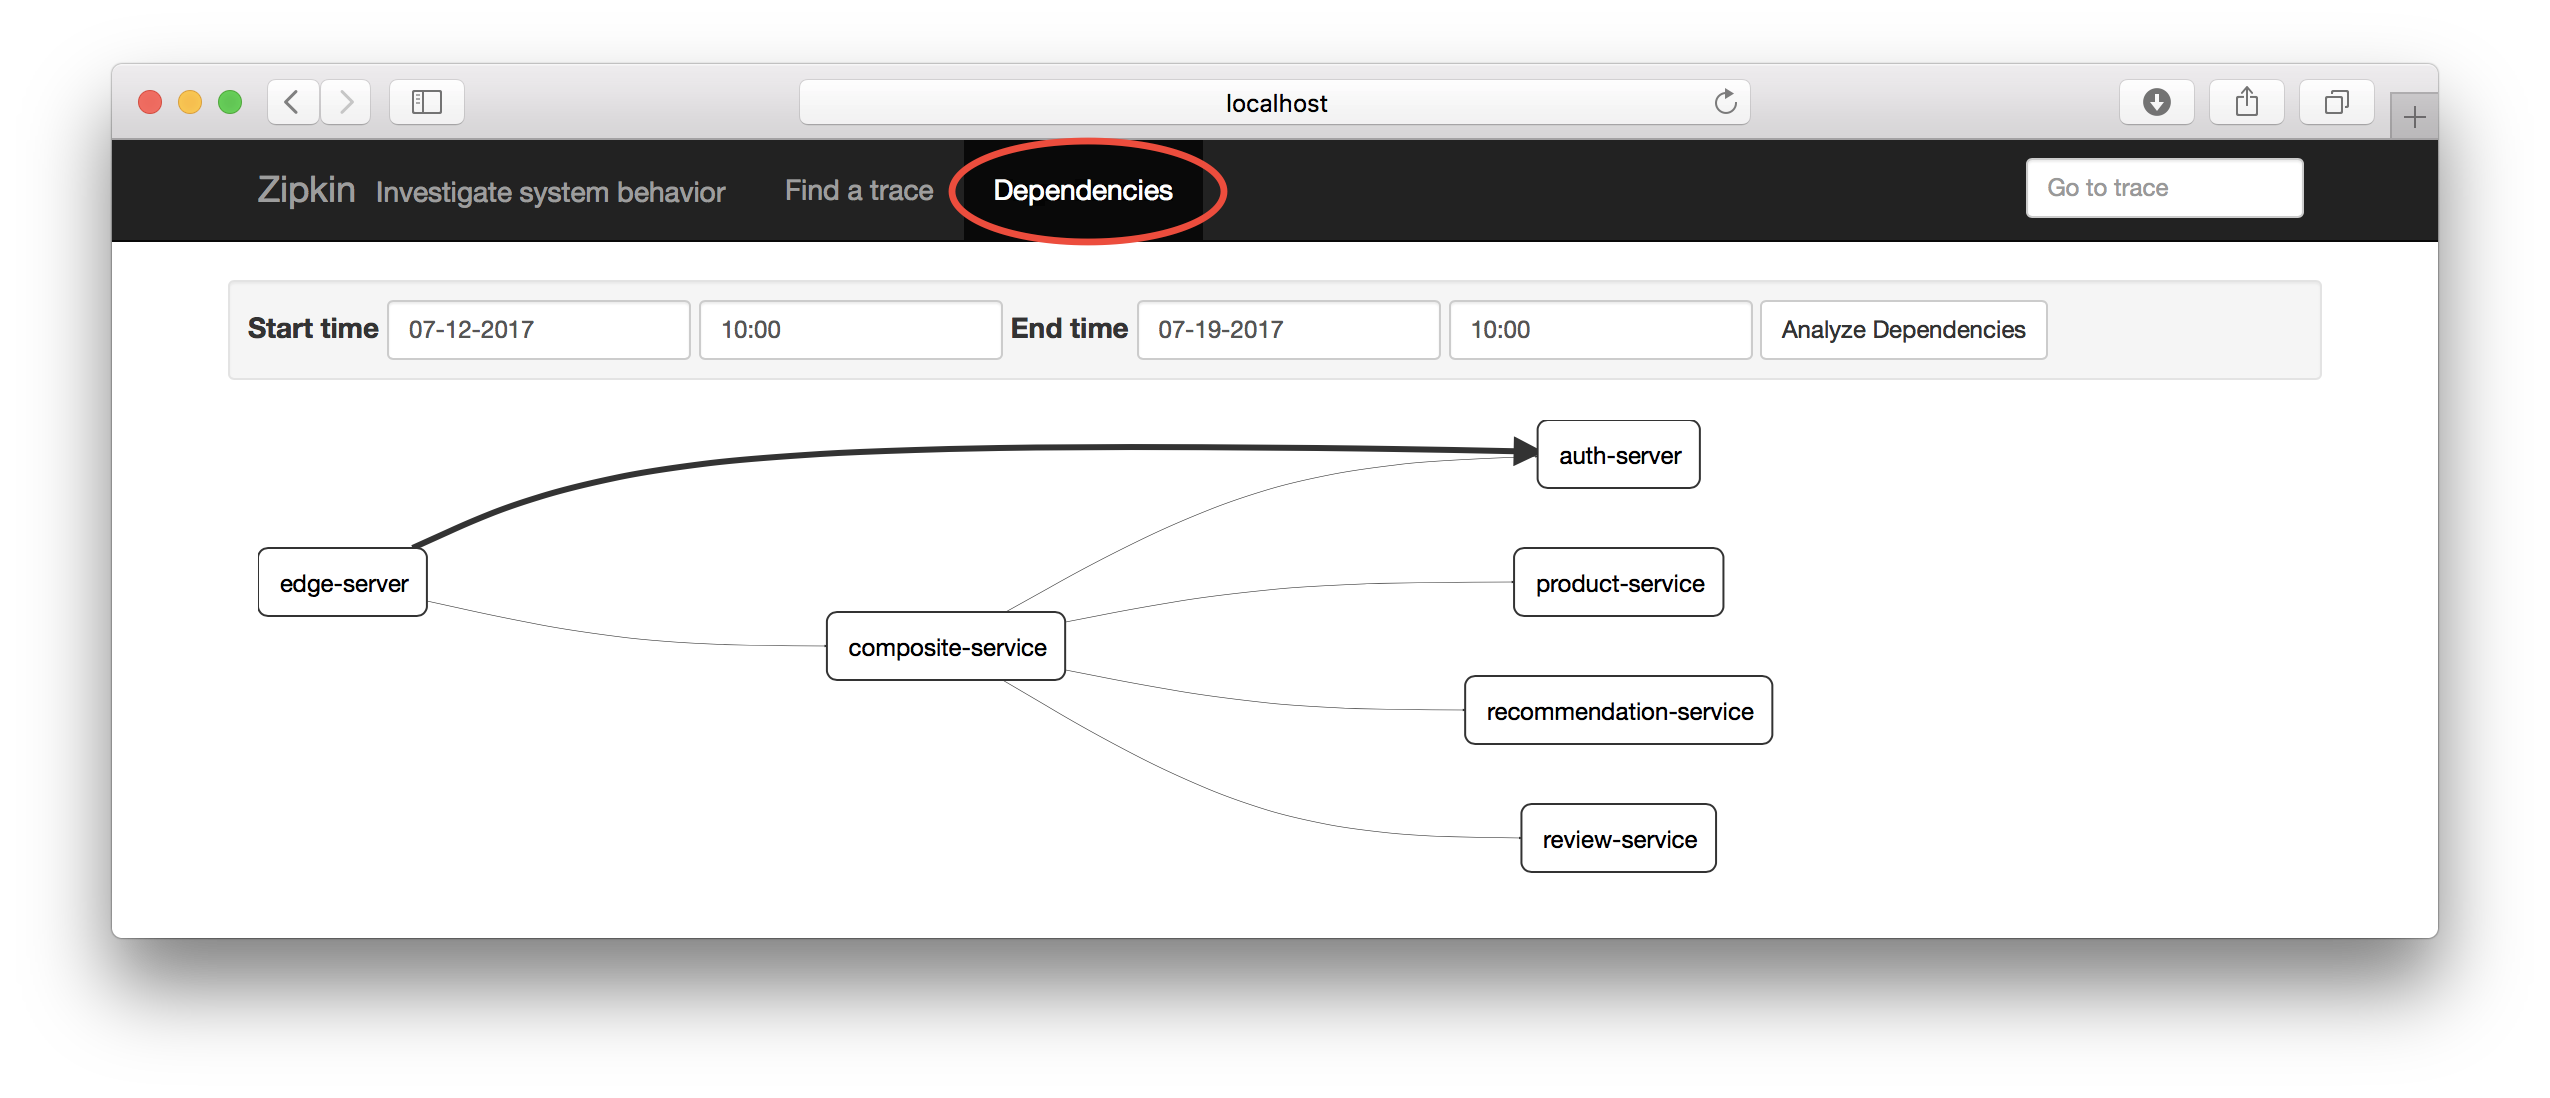
Could be useful in a larger microservice - landscape, don’t you think?
The Web UI uses a query API in the Zipkin server that is public, i.e. you can use it to build your own search front end. For details see: http://zipkin.io/zipkin-api/#/. Let’s try it out!
Hint: Prepare for receiving large responses! They are not expected to be consumed by the human eye, but programmatically :-)
Start with repeating the query for a specific HTTP request URI:
$ curl http://localhost:9411/api/v1/traces?annotationQuery="http.path=/api/product/456" | jq .
Next try searching for a specific Trace Id (pick one from your log events):
$ curl http://localhost:9411/api/v1/trace/917e8549d0324e3f | jq .
Finally lookup all traces where a specific microservice has been involved:
$ curl http://localhost:9411/api/v1/traces?serviceName=edge-server | jq .
If you want to refine the traces-queries you can experiment with the query parameters: endsTs, lookback and limit. Se the API docs for details.
Examples for the interested reader to try out on yourself:
Make a microservice slow by increasing its response time
Force the Circuit Breaker to Open its Circuit and verify the shorter response time when “fail fast” is applied
Hint: See section 3.3 - 3.7 in this blog post for instructions.
Next up in the blog series - Building Microservices, is centralized logging with the ELK stack. Thanks to trace ids introduced by Spring Cloud Sleuth in the log events we are already half way, stay tuned…