Blogg
Här finns tekniska artiklar, presentationer och nyheter om arkitektur och systemutveckling. Håll dig uppdaterad, följ oss på Twitter
Här finns tekniska artiklar, presentationer och nyheter om arkitektur och systemutveckling. Håll dig uppdaterad, följ oss på Twitter

In this part of the Go microservices blog series, we’ll introduce a logging strategy for our Go microservices based on Logrus, the Docker Gelf logging driver and the “Logging as a Service” service Loggly.
Logs. You never know how much you miss them until you do. Having guidelines for your team about what to log, when to log and how to log, may be one of the key factors for producing a maintainable application. Then, microservices happen.
While dealing with one or a few different log files for a monolithic application is usually manageable (though exceptions exist…), consider doing the same for a microservice-based application with potentially hundreds or even thousands of service containers each producing logs. Don’t even consider going big if you don’t have a solution for collecting and aggregating your logs in a well-structured manner.
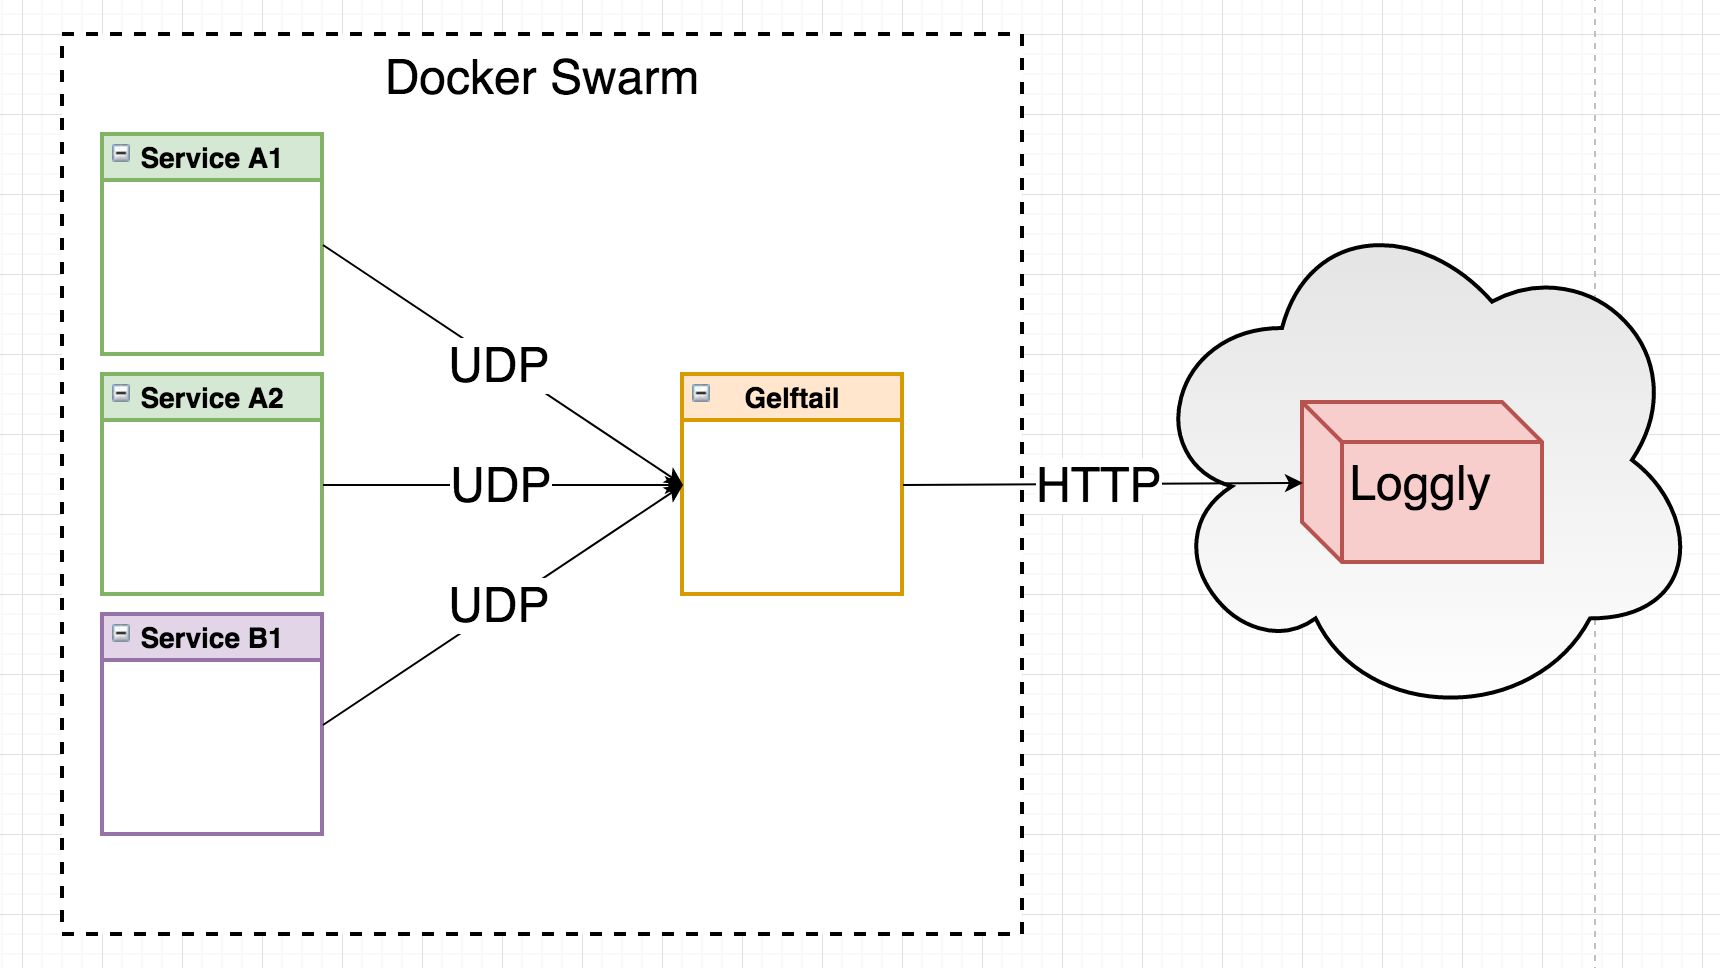
Thankfully, a lot of smart people have already thought about this - the stack formerly know as ELK is perhaps one of the most well-known within the open source community. ElasticSearch, LogStash and Kibana forms the Elastic Stack which I recommend for both on-premise and cloud deployments. However, there probably exists dozens of blog posts about ELK, so in this particular blog, we’ll explore a LaaS (Logging as a Service) solution for our centralized logging needs based on four parts:
The finished source can be cloned from github:
> git clone https://github.com/callistaenterprise/goblog.git
> git checkout P10
Note: Most of the Go source code for the blog series was rewritten in July 2019 to better reflect contemporary idiomatic Go coding guidelines and design patterns. However, the corresponding git branch for each part of the series remains unchanged in order to stay aligned with the content of each installment. For the latest and greatest code, look at the master branch in github.
Typically, our Go microservices has up until now logged using either the “fmt” or the “log” packages, either to stdout or stderr. We want something giving us more fine-granular control of log levels and formatting. In the Java world, many (most?) of us have dealt with frameworks such as log4j, logback and slf4j. Logrus is our logging API of choice for this blog series, it roughly provides the same type of functionality as the APIs I just mentioned regarding levels, formatting, hooks etc.
One of the neat things with logrus is that it implements the same interface(s) we’ve used for logging up until now - fmt and log. This means we can more or less use logrus as a drop-in replacement. Start by making sure your GOPATH is correct before fetching logrus source so it’s installed into your GOPATH:
> go get github.com/sirupsen/logrus
We’ll do this the old-school way. For /common, /accountservice and /vipservice respectively - use your IDE or text editor to do a global search&replace where fmt.* and log.* are replaced by logrus.*. Now you should have a lot of logrus.Println and logrus.Printf calls. Even though this works just fine, I suggest using logrus more fine-granular support for severities such as INFO, WARN, DEBUG etc. For example:
| fmt | log | logrus |
| Println | Println | Infoln |
| Printf | Printf | Infof |
| Error | Errorln |
There is one exception which is fmt.Error which is used to produce error instances. Do not replace fmt.Error.
Given that we’ve replaced a lot of log.Println and fmt.Println with logrus.Println (and other logging functions), we have a lot of unused imports now that’ll give us compile errors. Instead of fixing the files one at a time, we can use a niftly little tool that can be downloaded and executed on the command-line (or integrated into your IDE of choice) - goimports.
Again, make sure your GOPATH is correct. Then use go get to download goimports:
go get golang.org/x/tools/cmd/goimports
This will install goimports into your $GOPATH/bin folder. Next, you can go to the root of the accountservice or vipservice service, e.g:
cd $GOPATH/src/github.com/callistaenterprise/goblog/accountservice
Then, run goimports, telling it to fix imports recursively with the “-w” flag which applies the changes directly to the source files.
$GOPATH/bin/goimports -w **/*.go
Repeat for all our microservice code, including the /common folder.
Run go build to make sure the service compiles.
go build
If we don’t configure Logrus at all, it’s going to output log statements in plain text. Given:
logrus.Infof("Starting our service...")
It will output:
INFO[0000] Starting our service...
Where 0000 is the number of seconds since service startup. Not what I want, I want a datetime there. So we’ll have to supply a formatter.
The init() function is a good place for that kind of setup:
func init() {
	logrus.SetFormatter(&logrus.TextFormatter{
		TimestampFormat: "2006-01-02T15:04:05.000",
		FullTimestamp: true,
	})
}
New output:
INFO[2017-07-17T13:22:49.164] Starting our service...
Much better. However, in our microservice use-case, we want the log statements to be easily parsable so we eventually can send them to our LaaS of choice and have the log statements indexed, sorted, grouped, aggreagated etc. Therefore we’ll want to use a JSON formatter instead whenever we’re not running the microservice in standalone (i.e. -profile=dev) mode.
Let’s change that init() code somewhat so it’ll use a JSON formatter instead unless the “-profile=dev” flag is passed.
func init() {
    profile := flag.String("profile", "test", "Environment profile")
	if *profile == "dev" {
		logrus.SetFormatter(&logrus.TextFormatter{
			TimestampFormat: "2006-01-02T15:04:05.000",
			FullTimestamp: true,
		})
	} else {
		logrus.SetFormatter(&logrus.JSONFormatter{})
	}
}
Output:
{"level":"info","msg":"Starting our service...","time":"2017-07-17T16:03:35+02:00"}
That’s about it. Feel free to read the Logrus docs for more comprehensive examples.
It should be made clear that the standard logrus logger doesn’t provide the kind of fine-granular control you’re perhaps used to from other platforms - for example changing the output from a given package to DEBUG through configuration. It is however possible to create scoped logger instances which makes more fine-grained configuration possible, e.g:
var LOGGER = logrus.Logger{}   // <-- Create logger instance

func init() {
	// Some other init code...

	// Example 1 - using global logrus API
	logrus.Infof("Successfully initialized")

	// Example 2 - using logger instance
	LOGGER.Infof("Successfully initialized")
}
(example code, not in repo)
By using a LOGGER instance it’s possible to configure the application-level logging in a more fine-granular way. However, I’ve chosen to do “global” logging for now using logrus.* for this part of the blog series.
What’s GELF? It’s an acronym for Greylog Extended Log Format which is the standard format for logstash. Basically, it’s logging data structed as JSON. In the context of Docker, we can configure a Docker Swarm Mode service to do its logging using various drivers which actually means that everything written within a container to stdout or stderr is “picked up” by Docker Engine and is processed by the configured logging driver. This processing includes adding a lot of metadata about the container, swarm node, service etc. that’s specific to Docker. A sample message may look like this:
{
      "version":"1.1",
      "host":"swarm-manager-0",
      "short_message":"Starting HTTP service at 6868",
      "timestamp":1.487625824614e+09,
      "level":6,
      "_command":"./vipservice-linux-amd64 -profile=test",
      "_container_id":"894edfe2faed131d417eebf77306a0386b43027e0bdf75269e7f9dcca0ac5608",
      "_container_name":"vipservice.1.jgaludcy21iriskcu1fx9nx2p",
      "_created":"2017-02-20T21:23:38.877748337Z",
      "_image_id":"sha256:1df84e91e0931ec14c6fb4e559b5aca5afff7abd63f0dc8445a4e1dc9e31cfe1",
      "_image_name":"someprefix/vipservice:latest",
      "_tag":"894edfe2faed"
}
Let’s take a look at how to change our “docker service create” command in copyall.sh to use the GELF driver:
docker service create \
--log-driver=gelf \
--log-opt gelf-address=udp://192.168.99.100:12202 \
--log-opt gelf-compression-type=none \
--name=accountservice --replicas=1 --network=my_network -p=6767:6767 someprefix/accountservice
That’s more or less it! Any microservice instance created of the accountservice type will now send everything written to stdout/stderr to the configured endpoint. Do note that this means that we can’t use docker logs [containerid] command anymore to check the log of a given service since the (default) logging driver isn’t being used anymore.
We should add these gelf log driver configuration statements to all docker service create commands in our shell scripts, e.g. copyall.sh.
There’s one kludgy issue with this setup though - the use of a hard-coded IP-address to the Swarm Manager. Regrettably, even if we deploy our “gelftail” service as a Docker Swarm mode service, we can’t address it using its logical name when declaring a service. We can probably work around this drawback somehow using DNS or similar, feel free to enlighten us in the comments if you know how ;)
If you really need to make your logging more container-orchestrator agnostic, an option is to use the gelf plugin for Logrus to do GELF logging using hooks. In that setup, Logrus will format log statements to the GELF format by itself and can also be configured to transmit them to a UDP address just like when using the Docker GELF driver. However - by default Logrus has no notion about running in a containerized context so we’d basically have to figure out how to populate all that juicy metadata ourselves - perhaps using calls to the Docker Remote API or operating system functions.
I strongly recommend using the Docker GELF driver. Even though it ties your logging to Docker Swarm mode, other container orchestrators probably have similar support for collecting stdout/stderr logs from containers with forwarding to a central logging service.
That UDP server where all log statement are sent is often Logstash or similar, that provides powerful control over transformation, aggregation, filtering etc. of log statements before storing them in a backend such as Elasticsearch or pushing them to a LaaS.
However, Logstash isn’t exactly lightweight and in order to keep things simple (and fun!) we’re going to code our very own little “log aggregator”. I’m calling it “gelftail”. The name comes from the fact that once I had configured the Docker GELF driver for all my services, I had no way of seeing what was being logged anymore! I decided to write a simple UDP server that would pick up all data sent to it and dump to stdout, which then I could look at using docker logs. E.g. a stream of all log statements from all services. Not very practical but at least better than not seeing any logs at all.
The natural next step were then to attach this “gelftail” program to a LaaS backend, apply a bit of transformation, statement batching etc. which is exactly what we’re going to develop right away!
In the root /goblog folder, create a new directory called gelftail. Follow the instructions below to create the requisite files and folders.
mdkir $GOPATH/src/github.com/callistaenterprise/goblog/gelftail
mdkir $GOPATH/src/github.com/callistaenterprise/goblog/gelftail/transformer
mdkir $GOPATH/src/github.com/callistaenterprise/goblog/gelftail/aggregator
cd $GOPATH/src/github.com/callistaenterprise/goblog/gelftail
touch gelftail.go
touch transformer/transform.go
touch aggregator/aggregator.go
Gelftail works along these lines:
Expressed using classic Enterprise Integration patterns (in a somewhat non-idiomatic way…) it looks like this:
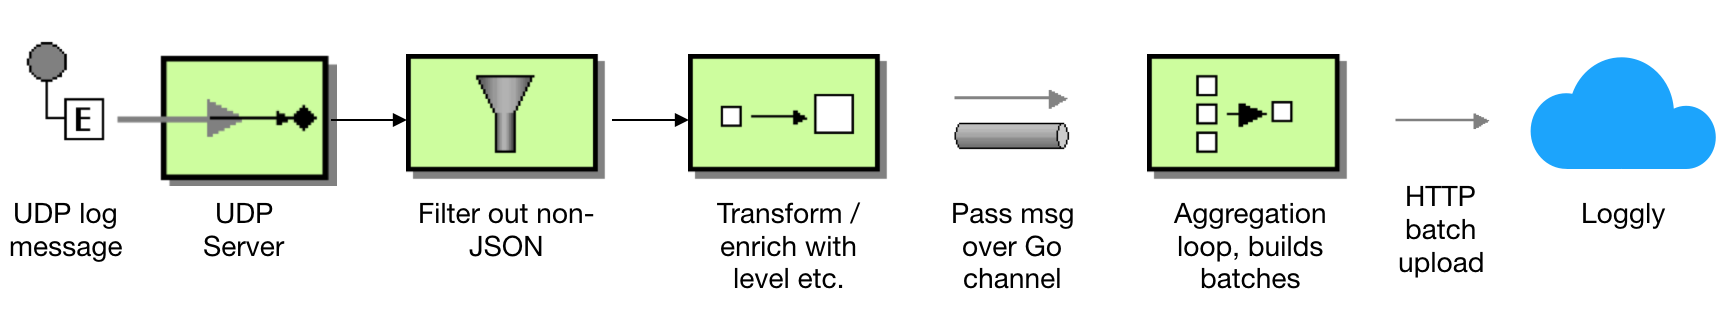
The program will be split into three files. Start with gelftail.go with a main package and some imports:
package main

import (
	"bytes"
	"encoding/json"
	"flag"
	"fmt"
	"net"
	"net/http"
	"os"
    "io/ioutil"
	"github.com/Sirupsen/logrus"
)
When registering with Loggly (our LaaS of choice for this blog series), we get an Authentication token that you must treat as a secret. Anyone having access to your token can at least send log statements into your account. So make sure you .gitignore token.txt or whatever name you pick for the file. Of course, one could use the configuration server from Part 7 and store the auth token as an encrypted property. For now, I’m keeping this as simple as possible so text file it is.
So let’s add a placeholder for our LaaS token and an init() function that tries to load this token from disk. If unsuccessful, we might as well log & panic.
var authToken = ""
var port *string

func init() {
	data, err := ioutil.ReadFile("token.txt")
    if err != nil {
        msg := "Cannot find token.txt that should contain our Loggly token"
        logrus.Errorln(msg)
        panic(msg)
    }
    authToken = string(data)

    port = flag.String("port", "12202", "UDP port for the gelftail")
    flag.Parse()
}
We also use a flag to take an optional port number for the UDP server. Next, time to declare our main() function to get things started.
func main() {
	logrus.Println("Starting Gelf-tail server...")

	ServerConn := startUDPServer(*port)   // Remember to dereference the pointer for our "port" flag
	defer ServerConn.Close()

	var bulkQueue = make(chan []byte, 1)  // Buffered channel to put log statements ready for LaaS upload into

	go aggregator.Start(bulkQueue, authToken)          // Start goroutine that'll collect and then upload batches of log statements
	go listenForLogStatements(ServerConn, bulkQueue)   // Start listening for UDP traffic

	logrus.Infoln("Started Gelf-tail server")

	wg := sync.WaitGroup{}
	wg.Add(1)
	wg.Wait()              // Block indefinitely
}
Quite straightforward - start the UDP server, declare the channel we’re using to pass processed messages and start the “aggregator”. The startUDPServer(*port) function is not very interesting, so we’ll skip forward to listenForLogStatements(..):
func listenForLogStatements(ServerConn *net.UDPConn, bulkQueue chan[]byte) {
	buf := make([]byte, 8192)                        // Buffer to store UDP payload into. 8kb should be enough for everyone, right Bill? :D
	var item map[string]interface{}                  // Map to put unmarshalled GELF json log message into
	for {
            n, _, err := ServerConn.ReadFromUDP(buf)     // Blocks until data becomes available, which is put into the buffer.
            if err != nil {
                logrus.Errorf("Problem reading UDP message into buffer: %v\n", err.Error())
                continue                                 // Log and continue if there are problms
            }

            err = json.Unmarshal(buf[0:n], &item)        // Try to unmarshal the GELF JSON log statement into the map
            if err != nil {                              // If unmarshalling fails, log and continue. (E.g. filter)
                logrus.Errorln("Problem unmarshalling log message into JSON: " + err.Error())
                item = nil
                continue
            }

            // Send the map into the transform function
            processedLogMessage, err := transformer.ProcessLogStatement(item)
            if err != nil {
                logrus.Printf("Problem parsing message: %v", string(buf[0:n]))
            } else {
                bulkQueue <- processedLogMessage          // If processing went well, send on channel to aggregator
            }
            item = nil
    }
}
Follow the comments in the code. The transformer.go file isn’t that exciting either, it just reads some stuff from one json property and transfers that onto the “root” GELF message. So let’s skip that.
Finally, a quite peek at the “aggregator” code in /goblog/gelftail/aggregator/aggregator.go that processes the final log messages from the bulkQueue channel, aggregates and uploads to Loggly:
var client = &http.Client{}
var logglyBaseUrl = "https://logs-01.loggly.com/inputs/%s/tag/http/"
var url string

func Start(bulkQueue chan []byte, authToken string) {
        url = fmt.Sprintf(logglyBaseUrl, authToken) // Assemble the final loggly bulk upload URL using the authToken
        buf := new(bytes.Buffer)
        for {
                msg := <-bulkQueue                 // Blocks here until a message arrives on the channel.
                buf.Write(msg)
                buf.WriteString("\n")              // Loggly needs newline to separate log statements properly.

                size := buf.Len()
                if size > 1024 {                   // If buffer has more than 1024 bytes of data...
                        sendBulk(*buf)  // Upload!
                        buf.Reset()
                }
        }
}
I just love the simplicity of Go code! Using a bytes.Buffer, we just enter an eternal loop where we block at msg := <-bulkQueue until a message is received over the (unbuffered) channel. We write the content + a newline to the buffer and then check whether the buffer is larger than our pre-determined 1kb threshold. If so, we invoke the sendBulk func and clear the buffer. sendBulk just does a standard HTTP POST to loggly.
Of course, we’ll deploy “gelftail” as a Docker Swarm mode service just as everything else. For that, we need a Dockerfile:
FROM iron/base

EXPOSE 12202/udp
ADD gelftail-linux-amd64 /
ADD token.txt /

ENTRYPOINT ["./gelftail-linux-amd64", "-port=12202"]
token.txt is a simple text file with the Loggly authorization token, more on that in section 4. of this blog post.
Building and deploying should be straightforward. We’ll add a new .sh script to the root /goblog directory:
#!/bin/bash

export GOOS=linux
export CGO_ENABLED=0

cd gelftail;go get;go build -o gelftail-linux-amd64;echo built `pwd`;cd ..

export GOOS=darwin

docker build -t someprefix/gelftail gelftail/
docker service rm gelftail
docker service create --name=gelftail -p=12202:12202/udp --replicas=1 --network=my_network someprefix/gelftail
This should run in a few seconds. Verify that gelftail was successfully started by tailing its very own stdout log. Find it’s container id using docker ps and then check the log using docker logs:
> docker logs -f e69dff960cec
time="2017-08-01T20:33:00Z" level=info msg="Starting Gelf-tail server..."
time="2017-08-01T20:33:00Z" level=info msg="Started Gelf-tail server"
If you do something with another service that logs stuff, the log output from that service should now appear in the tail above. Let’s scale the accountservice to two instances:
> docker service scale accountservice=2
The tailed docker logs above should now output some stuff such as:
time="2017-08-01T20:36:08Z" level=info msg="Starting accountservice"
time="2017-08-01T20:36:08Z" level=info msg="Loading config from http://configserver:8888/accountservice/test/P10\n"
time="2017-08-01T20:36:08Z" level=info msg="Getting config from http://configserver:8888/accountservice/test/P10\n"
That’s all for “gelftail”. Let’s finish this blog post by taking a quick peek at “Loggly”.
There are numerous “Logging as a Service” providers out there and I basically picked one (i.e. Loggly) that seemed to have a free tier suitable for demoing purposes, a nice GUI and a rich set of options for getting your log statements uploaded.
There is a plethora (see the list on the left in the linked page) of alternatives on how to get your logs into Loggly. I decided to use the HTTP/S event API that allows us to send multiple log statements in small batches by newline separation.
I suggest following their getting started guide, which can be boiled down to:
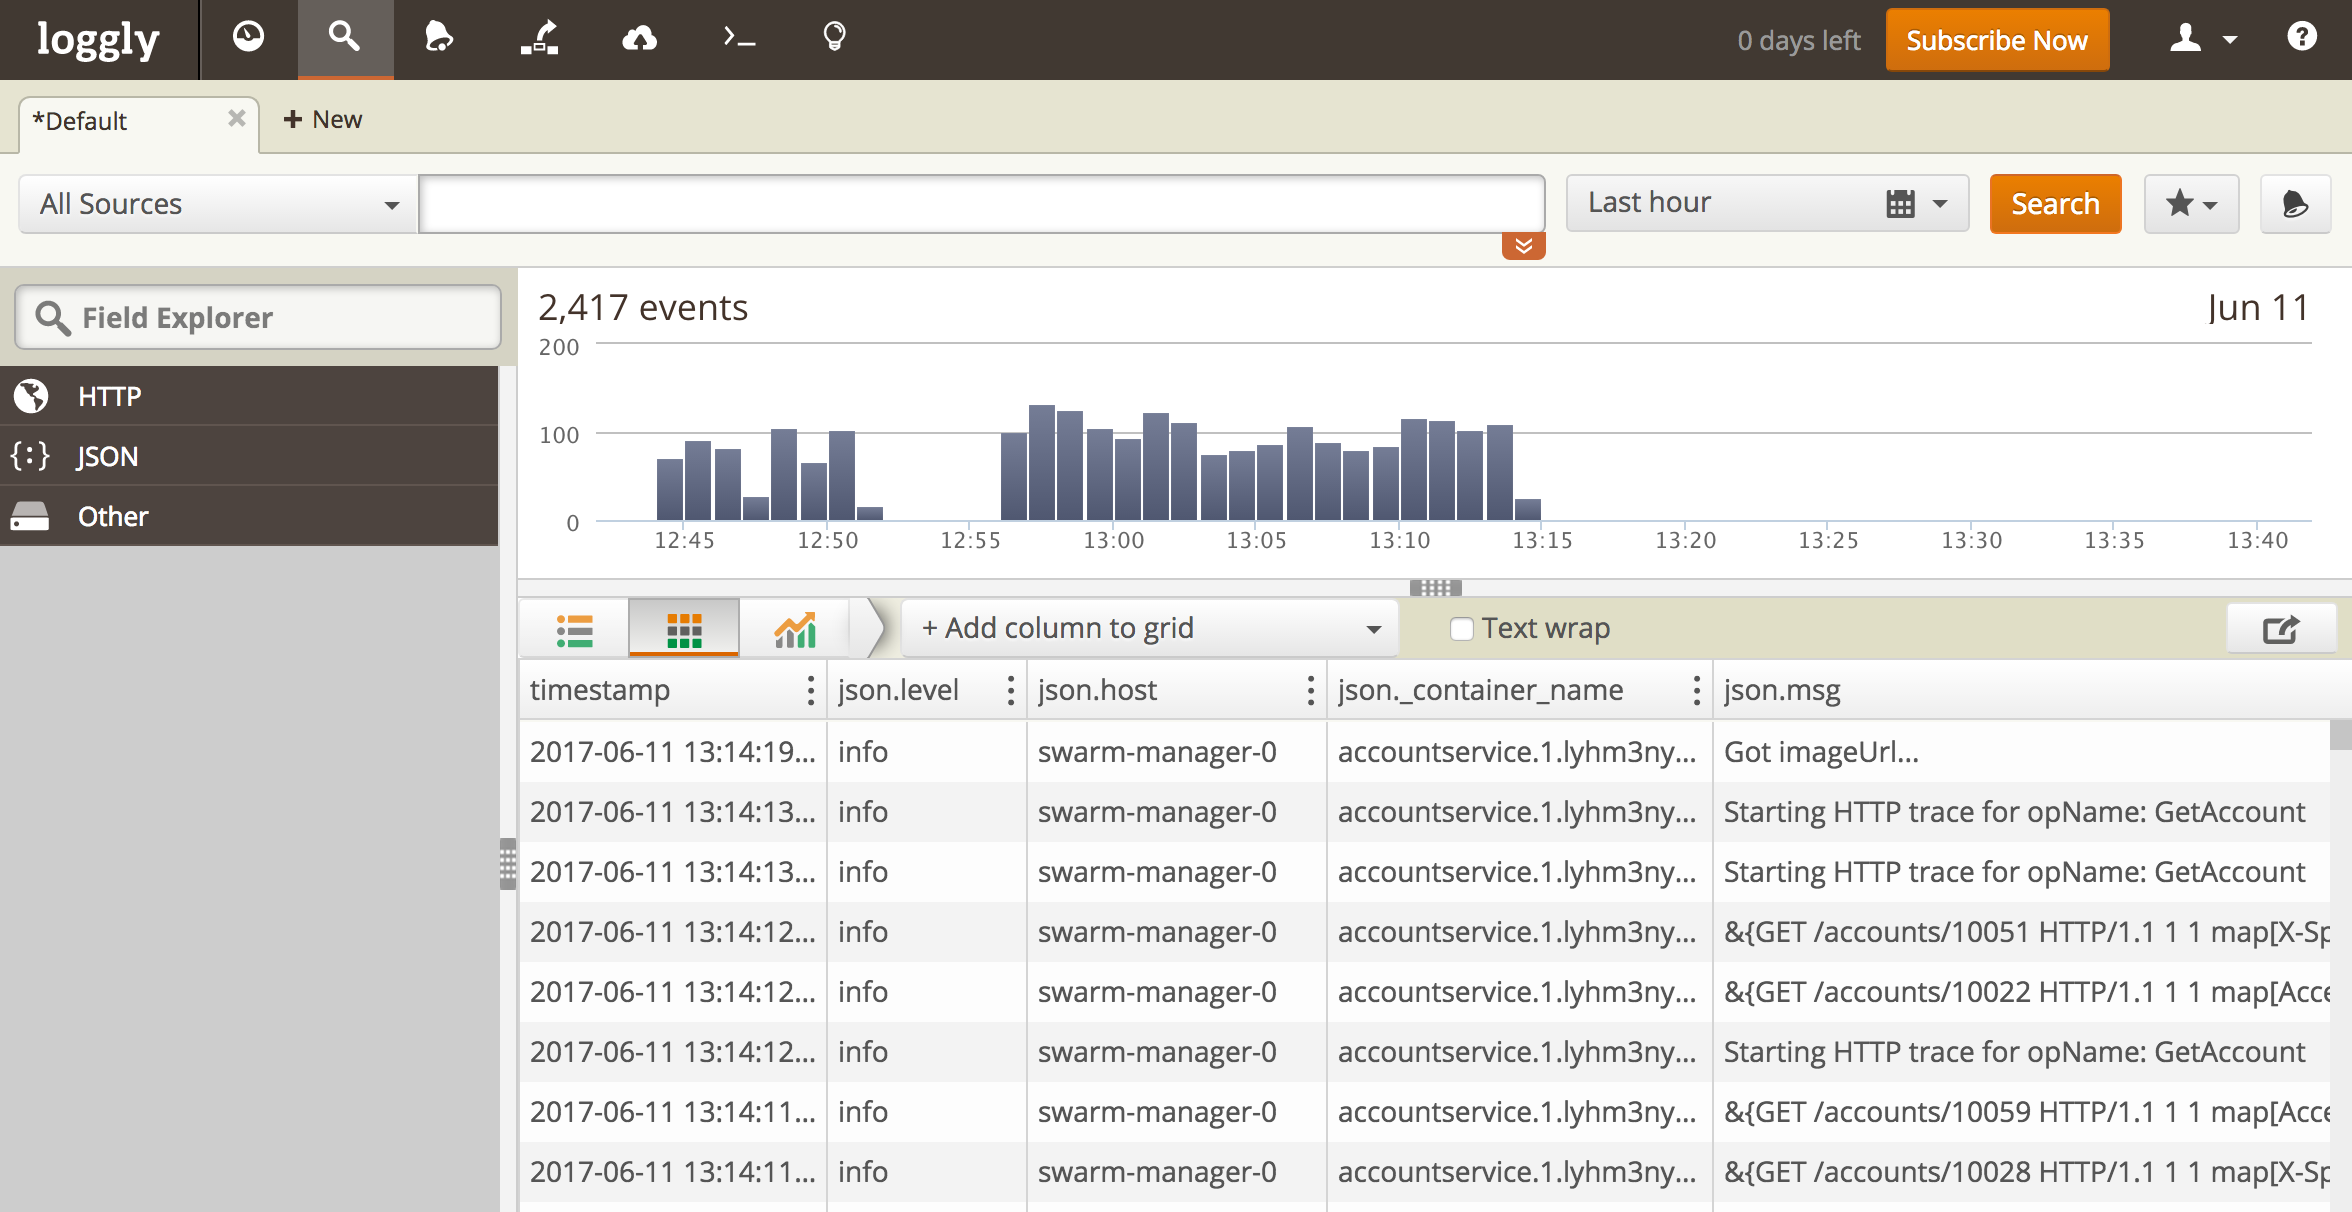
Leveraging all the bells & whistles of Loggly is out of scope for this blog post. I’ve only tinkered around with their dashboard and filtering functions which I guess is pretty standard as LaaS providers go.
In the first screenshot, I’ve zoomed in on a 35-minute time duration where I’m explicitly filtering on the “accountservice” and “info” messages:
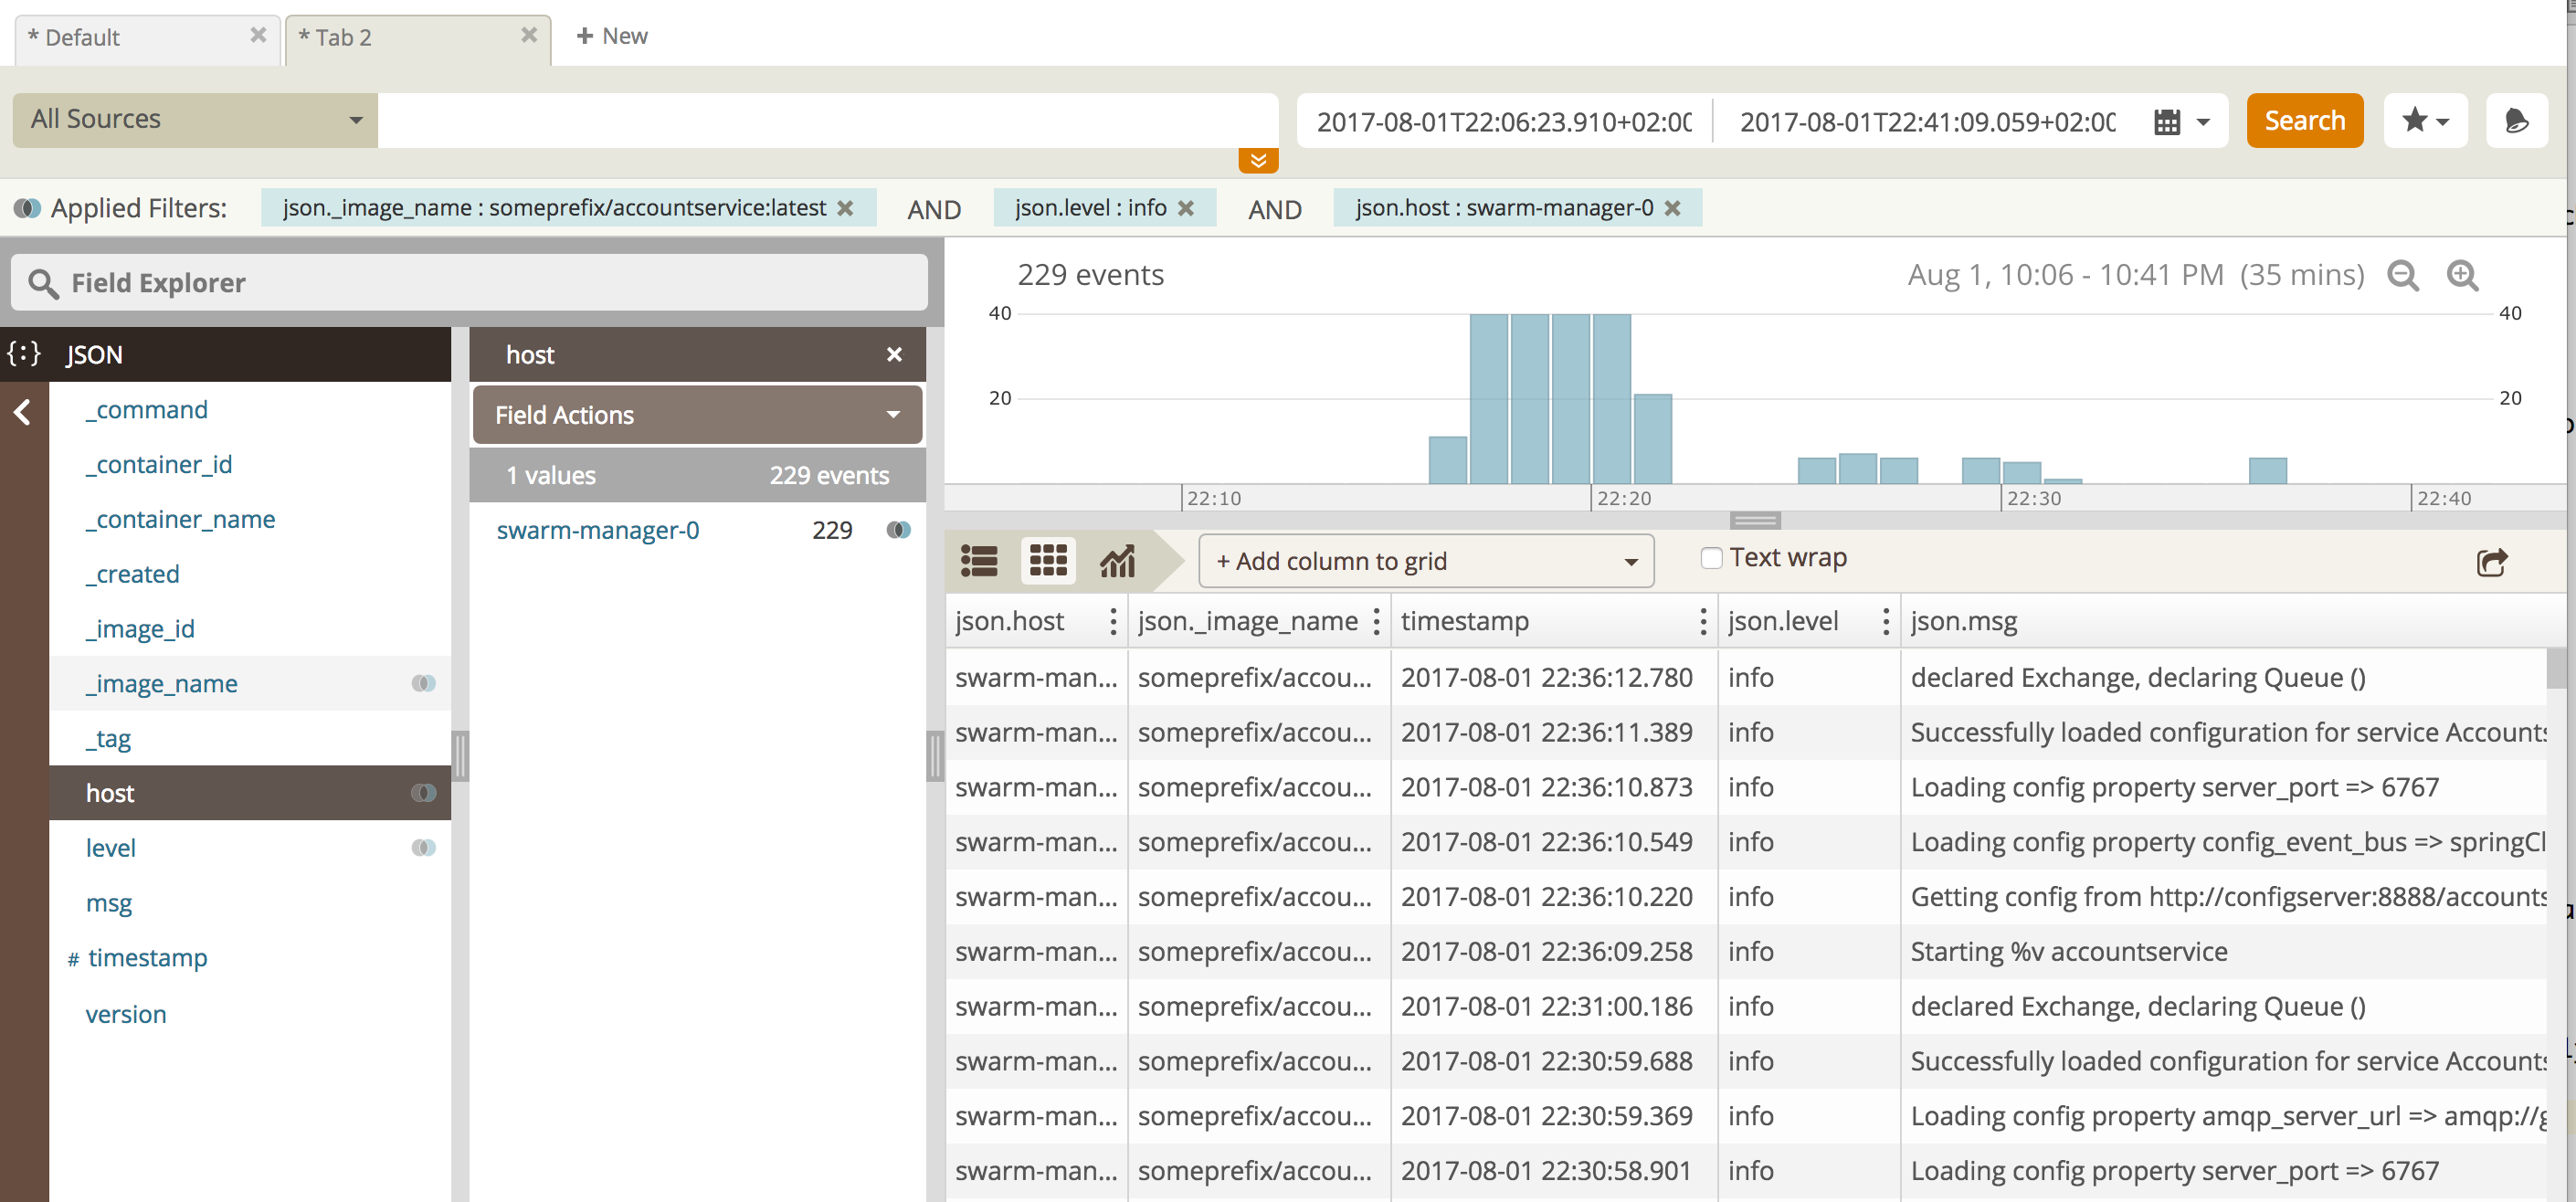
As seen, one can customize columns, filter values, time periods etc. very easily.
In the next sample, I’m looking at the same time period, but only at “error” log statements:
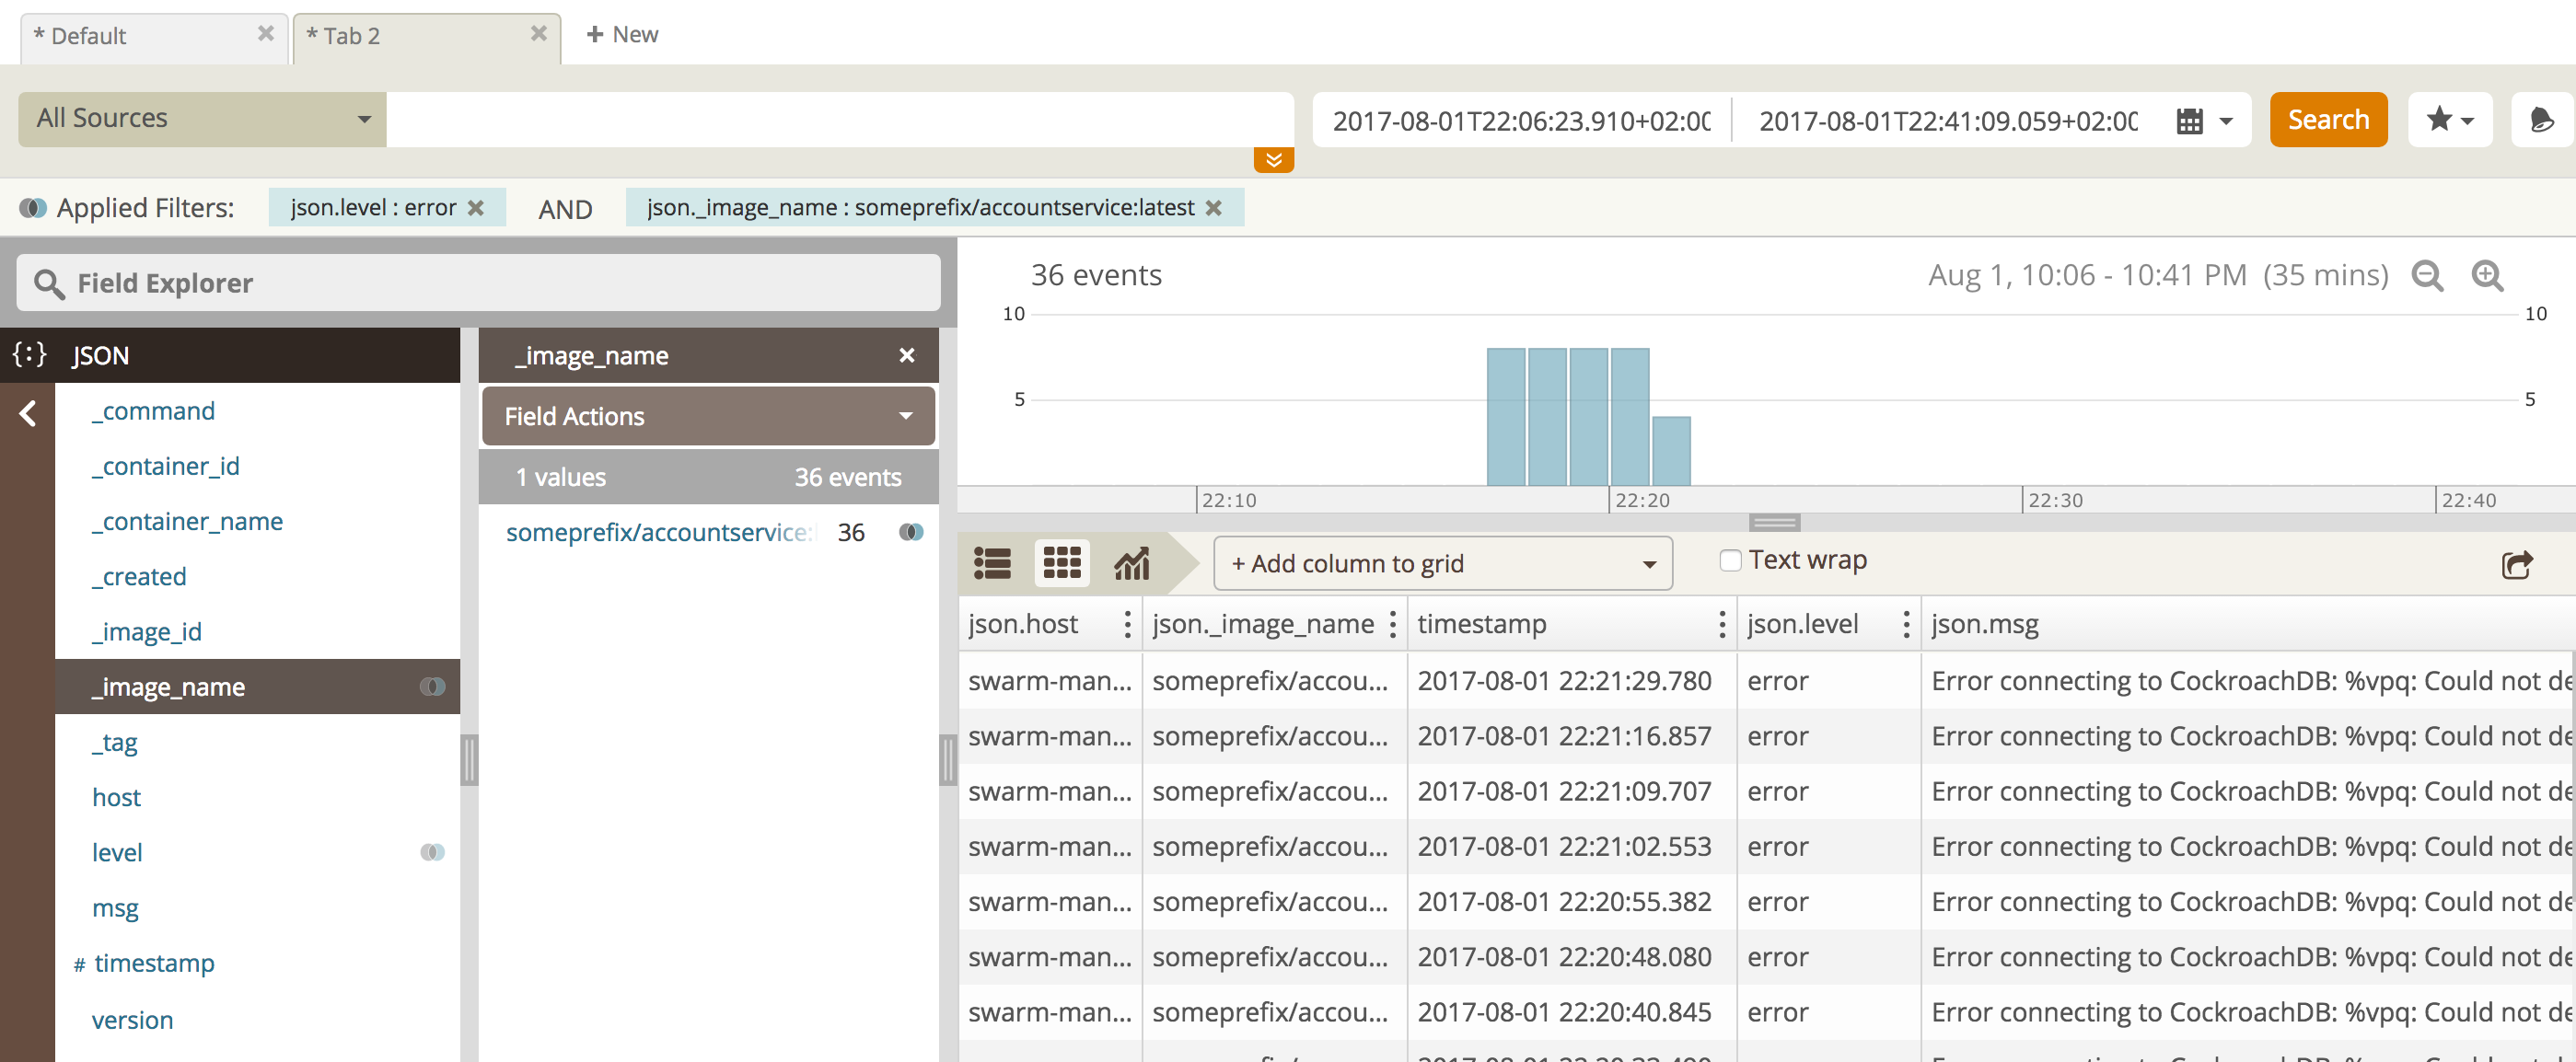
While these sample use cases are very simple, the real usefulness materializes when you’ve got dozens of microservices each running 1-n number of instances. That’s when the powerful indexing, filtering and other functions of your LaaS really becomes a fundamental part of your microservices operations model.
In part 10 of the blog series we’ve looked at centralized logging - why it’s important, how to do structured logging in your Go services, how to use a logging driver from your container orchestrator and finally pre-processing log statments before uploading them to a Logging as a Service provider.
In the next part, it’s time to add circuit breakers and resilience to our microservices using Netflix Hystrix.