Blogg
Här finns tekniska artiklar, presentationer och nyheter om arkitektur och systemutveckling. Håll dig uppdaterad, följ oss på Twitter
Här finns tekniska artiklar, presentationer och nyheter om arkitektur och systemutveckling. Håll dig uppdaterad, följ oss på Twitter

In this part of the Go microservices blog series, we’ll take on monitoring our microservices using Prometheus and graphing our data using Grafana.
(Please note that this is not an in-depth blog post about all the capabilities and features of Prometheus or Grafana. There’s better resources for that.)
The finished source can be cloned from github:
> git clone https://github.com/callistaenterprise/goblog.git
> git checkout P15
Note: Most of the Go source code for the blog series was rewritten in July 2019 to better reflect contemporary idiomatic Go coding guidelines and design patterns. However, the corresponding git branch for each part of the series remains unchanged in order to stay aligned with the content of each installment. For the latest and greatest code, look at the master branch in github.
In recent years, Prometheus has emerged as one of the major players in the Open Source space regarding collection of metric and monitoring data from (micro)services. At its heart, Prometheus stores metric values at a given millisecond in time in a time series database, optionally with one or more labels.
In this blog post we’ll deploy some new services and applications.
The architectural overview of the monitoring solution:
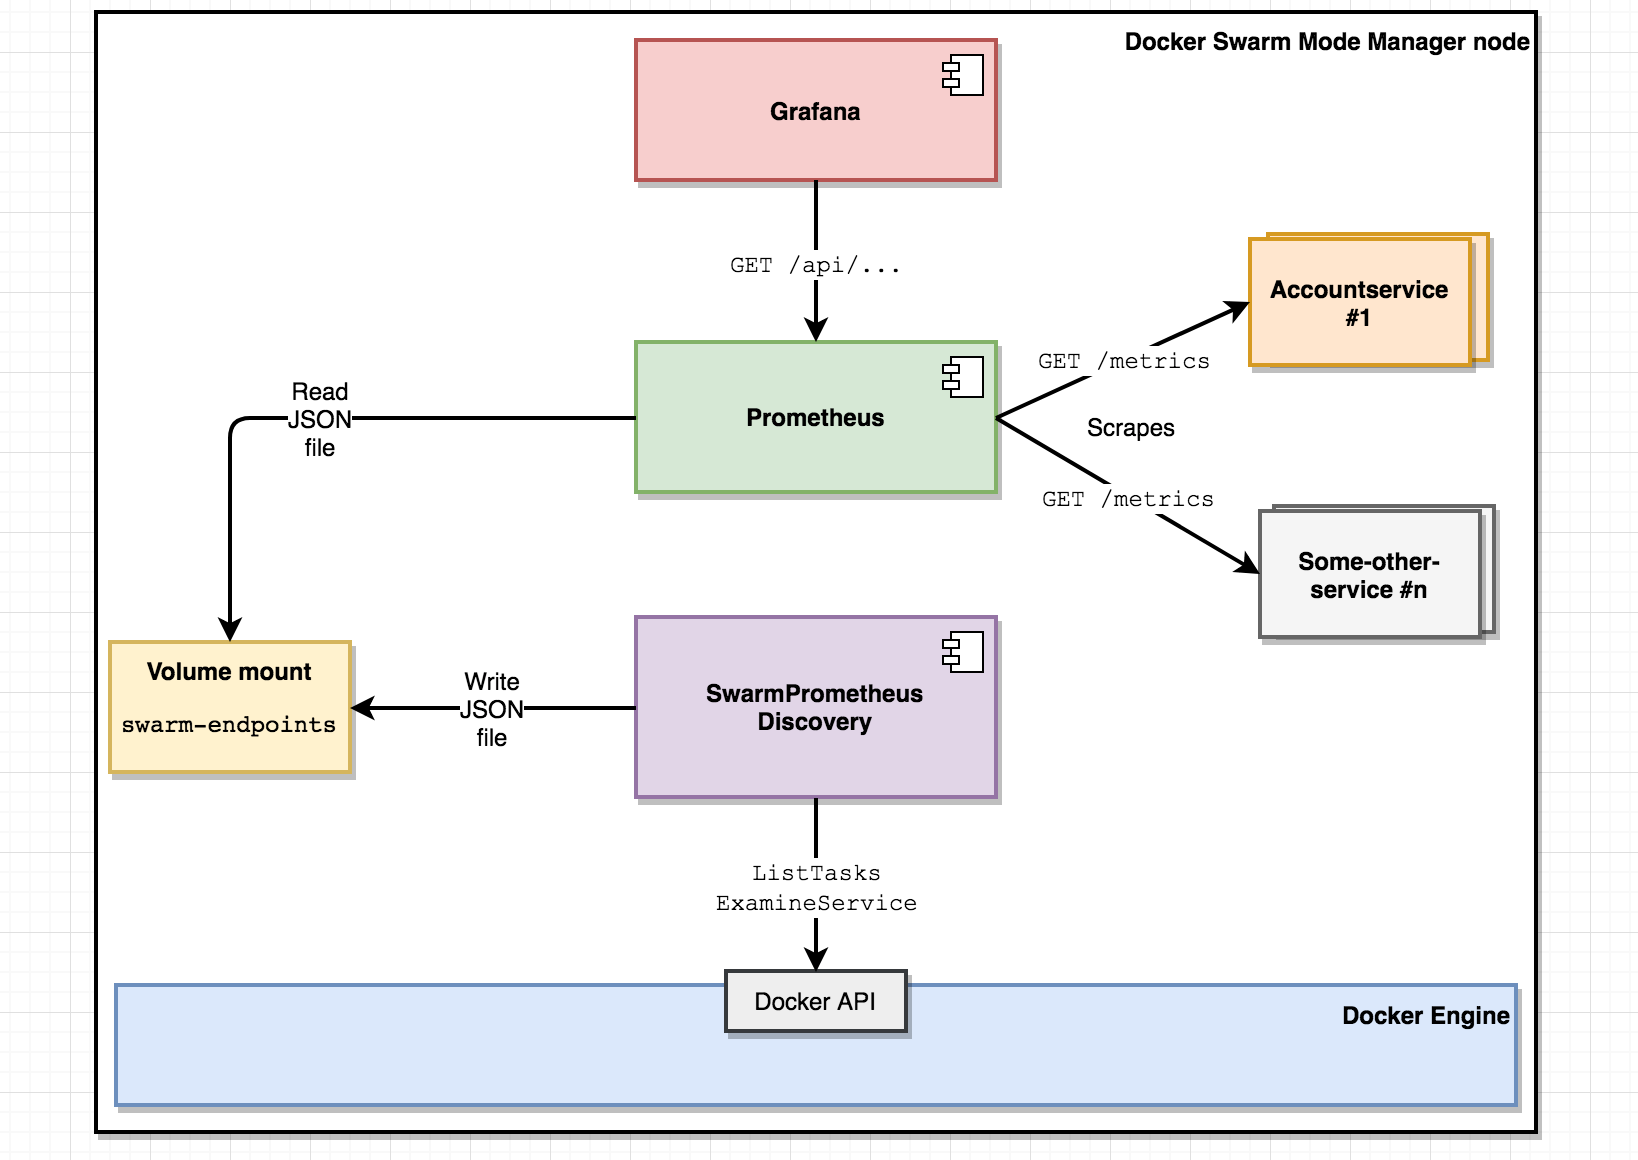
During the course of this blog post, we’ll accomplish the following:
Prometheus is an open-source toolkit for monitoring and alterting based on an embedded times-series database, a query DSL and various mechanics for scraping metrics data off endpoints.
In practice, from our perspective that boils down to:
The Prometheus server is written in Go.
Prometheus includes four different kinds of metrics:
I strongly recommend this JWorks blog post for in-depth information and explanations about Prometheus concepts.
Prometheus client libraries expose data using a really simple format:
# HELP go_memstats_heap_alloc_bytes Number of heap bytes allocated and still in use.
# TYPE go_memstats_heap_alloc_bytes gauge
go_memstats_heap_alloc_bytes 1.259432e+06
Labels and metadata about a metric such as go_memstats_heap_alloc_bytes (as exposed by the Go client library) comes with corresponding # HELP and # TYPE metadata.
Here’s an example summary metric from our lovely “accountservice” exposing the /accounts/{accountId} endpoint:
# HELP accountservice_GetAccount GET /accounts/{accountId}
# TYPE accountservice_GetAccount summary
accountservice_GetAccount{service="normal",quantile="0.5"} 0.02860325
accountservice_GetAccount{service="normal",quantile="0.9"} 0.083001706
accountservice_GetAccount{service="normal",quantile="0.99"} 0.424586416
accountservice_GetAccount_sum{service="normal"} 6.542147227
accountservice_GetAccount_count{service="normal"} 129
This summary metric captures the duration in seconds spent by each request, exposing this data as three quantiles (50th, 90th and 99th percentile) as well as total time spent and number of requests.
We’ll use the standard prom/prometheus docker image from docker hub with a custom configuration file.
If you’ve checked out P15 from git, enter the /support/prometheus directory where we have a sample Dockerfile as well as the prometheus.yaml linked above.
Dockerfile:
FROM prom/prometheus
ADD ./prometheus.yml /etc/prometheus/prometheus.yml
To build and deploy prometheus with our custom config from the support/prometheus folder:
> docker build -t someprefix/prometheus .
> docker service rm prometheus
> docker service create -p 9090:9090 --constraint node.role==manager --mount type=volume,source=swarm-endpoints,target=/etc/swarm-endpoints/,volume-driver=local --name=prometheus --replicas=1 --network=my_network someprefix/prometheus
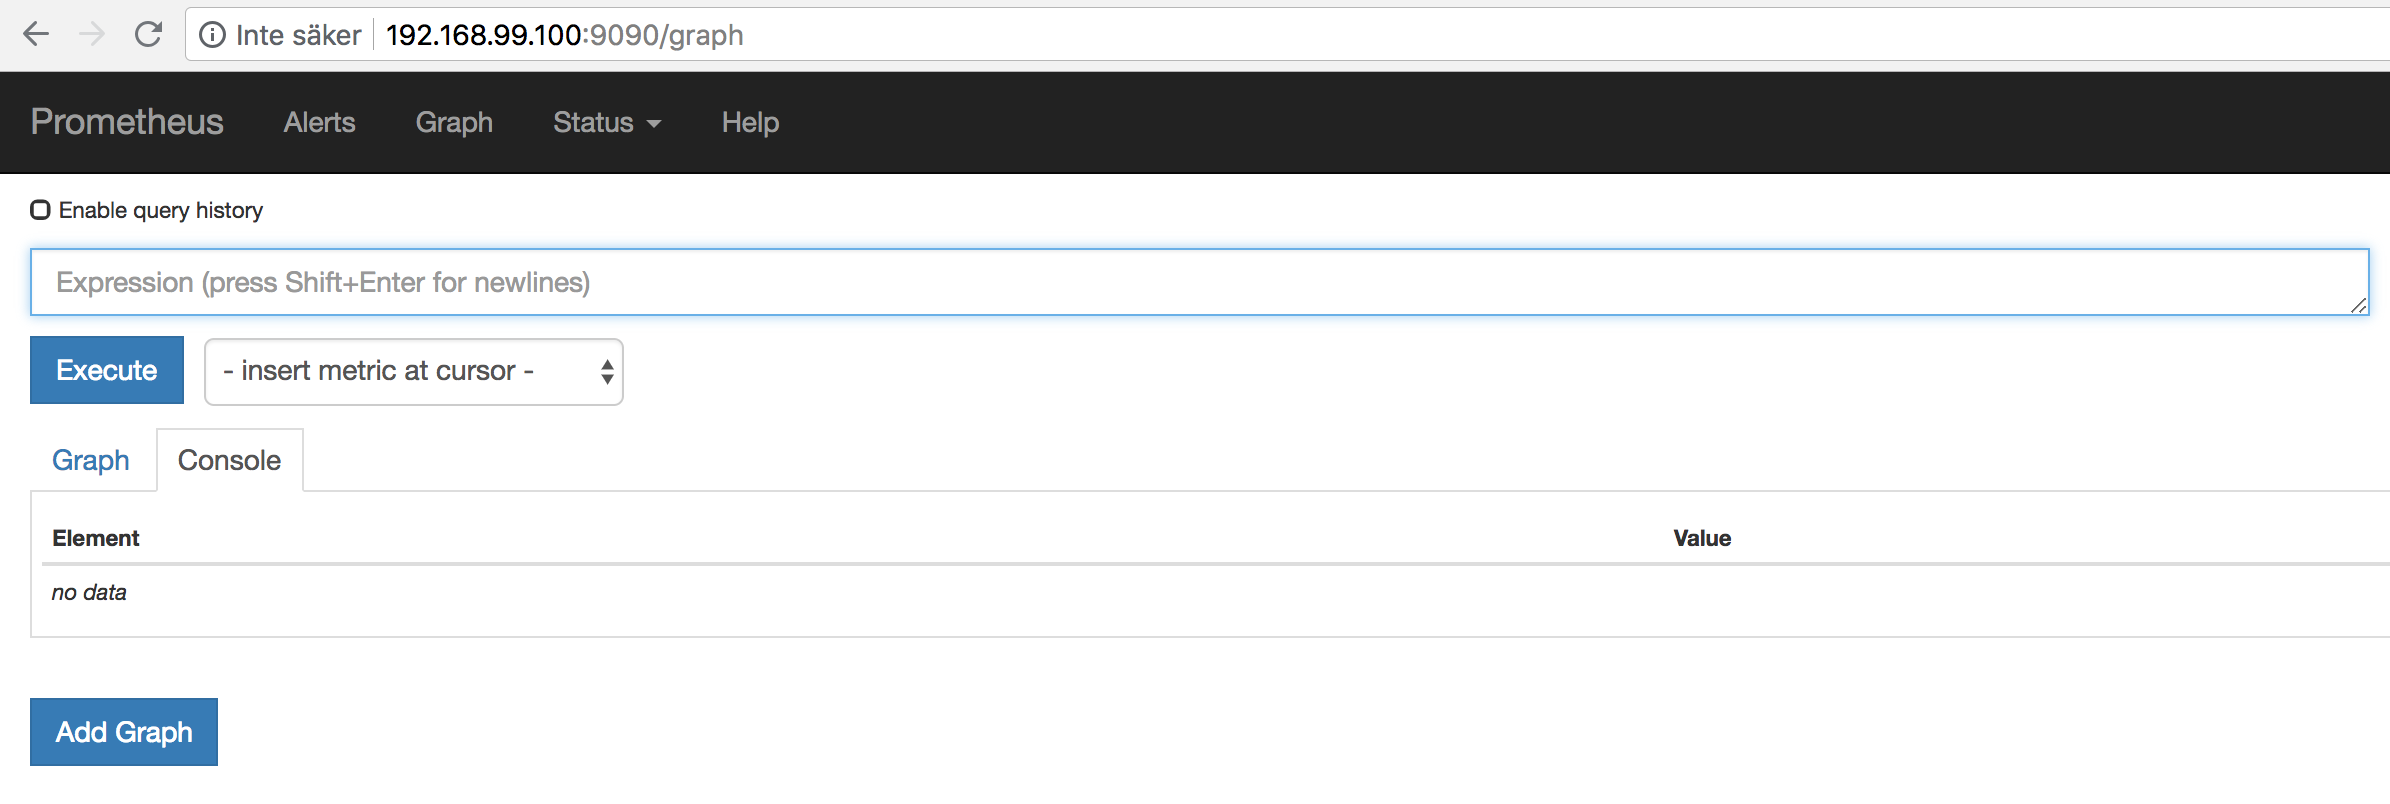
Prometheus should now be up-and-running on port 9090 of your cluster.
Please note that this is a non-persistent setup. In a real scenario, you’d want to set it up with requisite persistent storage.
How does Prometheus know which endpoints to scrape for metric data?
A vanilla install of Prometheus will just scrape itself which isn’t that useful. Luckily, scrape target discovery is highly configurable with built-in support for various container orchestrators, cloud providers and configuration mechanisms.
However, discovery of containers in Docker Swarm mode is not one of the officially supported mechanisms, so we’ll use the file_sd_config discovery configuration option instead. file_sd_config provides a generic way of letting Prometheus know which endpoints to scrape by reading a JSON file describing endpoints, ports and labels. The path is configured in Prometheus prometheus.yml config file, i.e:
scrape_configs:
  - job_name: swarm-service-endpoints
    file_sd_configs:
      - files:
        - /etc/swarm-endpoints/swarm-endpoints.json
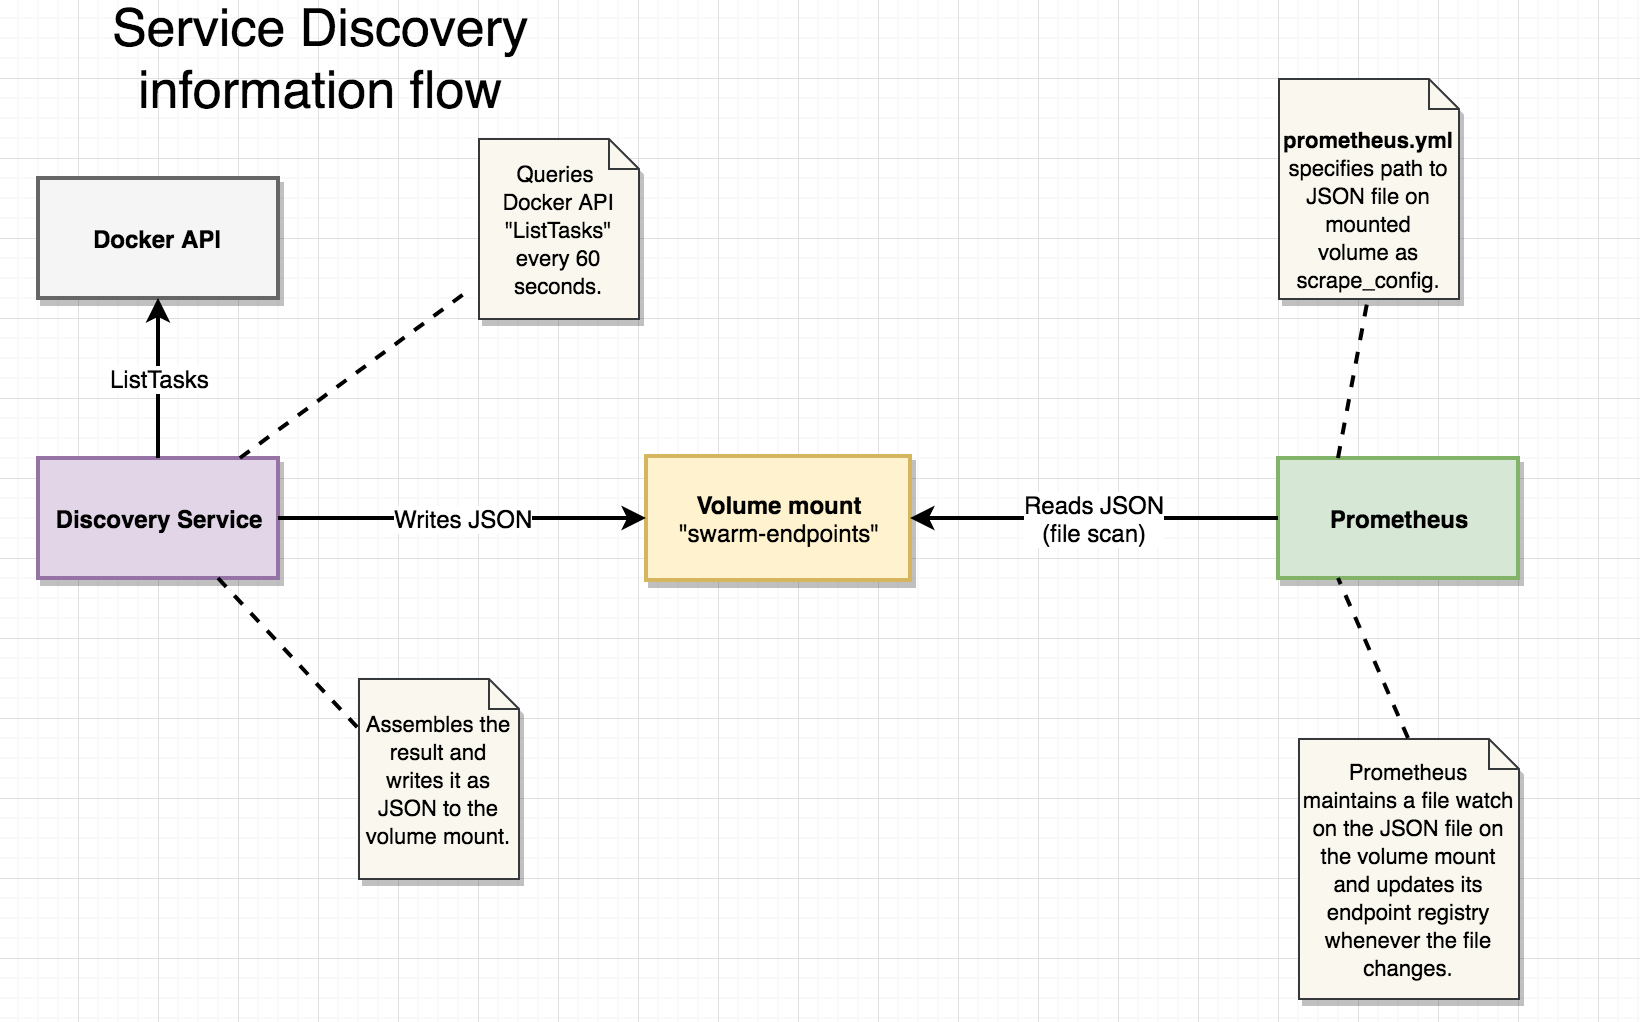
/etc/swarm-endpoints is a volume mount that Prometheus server will read from, while our discovery application described in section 3.2 will write the swarm-endpoints.json file to the very same volume mount.
The JSON format is simple, consisting of a list of entries having one or more “targets” and a map of key-value “label” pairs:
[
  {
    "targets": [
      "10.0.0.116:6767",
      "10.0.0.112:6767",
    ],
    "labels": {
      "task": "accountservice"
    }
  },
  .......
]
This example shows our “accountservice” running two instances. Remember that we cannot address the accountservice as a Docker Swarm mode “service” in this use-case since we want to scrape each running instance for its /metrics. Aggregation can be handled using the Query DSL of Prometheus.
I decided to write a simple discovery application (in Go of course!) to accomplish the task described above. It’s rather simple and fits into a single source file.
It does the following:
Some key parts of the implementation:
func main() {
	logrus.Println("Starting Swarm-scraper!")

	// Connect to the Docker API
	endpoint := "unix:///var/run/docker.sock"
	dockerClient, err := docker.NewClient(endpoint)
	if err != nil {
		panic(err)
	}

	// Find the networkID we want to address tasks on.
	findNetworkId(dockerClient, networkName)

	// Start the task poller, inlined function.
	go func(dockerClient *docker.Client) {
		for {
			time.Sleep(time.Second * 15)
			pollTasks(dockerClient)
		}
	}(dockerClient)

	// Block...
	log.Println("Waiting at block...")
    ... some code to stop the main method from exiting ...
}
Quite straightforward - obtain a docker client, determine ID of Docker network we want to work on (more on that later) and start the goroutine that will re-write that JSON file every 15 seconds.
Next, the pollTasks function performs the actual work. It’s objective is to transform the response of the ListTasks call from the Docker API into JSON structured according to the file_sd_config format we saw earlier in section 3.1. We’re using a struct for this purpose:
type ScrapedTask struct {
	Targets []string          `json:"targets"`
	Labels  map[string]string `json:"labels"`
}
The “Targets” and “Labels” are mapped into their expected lower-cased JSON names using json-tags.
Next, the actual code that does most of the work. Follow the comments.
func pollTasks(client *docker.Client) {

    // Get running tasks (e.g. containers) from the docker client.
	tasks, _ := client.ListTasks(docker.ListTasksOptions{Filters: filters})

	// Initialize a map that holds one "ScrapedTask" for a given serviceID
	tasksMap := make(map[string]*ScrapedTask)

    // Iterate over the returned tasks.
	for _, task := range tasks {

		// Lookup service
		service, _ := client.InspectService(task.ServiceID)

		// Skip if service is in ignoredList, e.g. don't scrape prometheus...
		if isInIgnoredList(service.Spec.Name) {
			continue
		}
		portNumber := "-1"

		// Find HTTP port of service.
		for _, port := range service.Endpoint.Ports {
			if port.Protocol == "tcp" {
				portNumber = fmt.Sprint(port.PublishedPort)
			}
		}

		// Skip if no exposed tcp port
		if portNumber == "-1" {
			continue
		}

        // Iterate network attachments on task
        for _, netw := range task.NetworksAttachments {

            // Only extract IP if on expected network.
            if netw.Network.ID == networkID {
                // The process functions extracts IP and stuffs IP+service name into the ScrapedTask instance for the
                // serviceID.
                if taskEntry, ok := tasksMap[service.ID]; ok {
                    processExistingTask(taskEntry, netw, portNumber, service)
                } else {
                    processNewTask(netw, portNumber, service, tasksMap)
                }
            }
        }
	}

	// Transform values of map into slice.
	taskList := make([]ScrapedTask, 0)
	for _, value := range tasksMap {
		taskList = append(taskList, *value)
	}

	// Get task list as JSON
	bytes, err := json.Marshal(taskList)
	if err != nil {
		panic(err)
	}

    // Open and write file
	file, err := os.Create("/etc/swarm-endpoints/swarm-endpoints.json")
	defer file.Close()
	if err != nil {
		fmt.Errorf("Error writing file: %v\n", err.Error())
		panic(err.Error())
	}
	file.Write(bytes)
}
Yes, the function is a bit too long, but it should be relatively easy to make sense of it. A few notes:
There’s not much more to it than this. Feel free to check out the complete source.
Note that there already exists a similar (more capable) project on github for this purpose one could try as well.
When packaging our discovery microservice into a Docker image, we use a very simple Dockerfile:
FROM iron/base

ADD swarm-prometheus-discovery-linux-amd64 /
ENTRYPOINT ["./swarm-prometheus-discovery-linux-amd64","-network", "my_network", "-ignoredServices", "prometheus,grafana"]
Note that we aren’t exposing any ports for inbound traffic since no one needs to ask the service anything. Also note the -network and -ignoredServices arguments:
To easily build & deploy the discovery service to Docker Swarm, there’s a simple shell script whose content should be quite familiar by now:
docker service create  --constraint node.role==manager\
--mount type=volume,source=swarm-endpoints,target=/etc/swarm-endpoints/\    <-- HERE!
--mount type=bind,source=/var/run/docker.sock,target=/var/run/docker.sock\  <-- HERE!
--name=swarm-prometheus-discovery --replicas=1 --network=my_network \
someprefix/swarm-prometheus-discovery
The two mounts may use a bit extra explanation:
Next, we’ll add the Go code necessary for making our microservices publish monitoring data in prometheus format on /metrics as well as making sure our RESTful endpoints (such as /accounts/{accountId}) produces prometheus monitoring data picked up and published on /metrics.
(If you’ve been following this series for a long time, you may notice that some of the Route stuff has been moved into common which facilitates some long-overdue code reuse.)
The /metrics endpoint Prometheus wants to scrape doesn’t appear by itself. We need to add a Route at /metrics that specifies a HTTP handler from the Prometheus Go client library:
Route{
    "Prometheus",
    "GET",
    "/metrics",
    promhttp.Handler().ServeHTTP,  <-- Handler from prometheus
    false,                         <-- Flag indicating whether to instrument this endpoint.
},
Note the new “false” argument. I’ve added it so we can control which endpoints of the microservice to apply Prometheus middleware for (see next section).
In our “accountservice” we have a number of RESTful HTTP endpoints such as:
We should definitely add prometheus monitoring for the first three endpoints, while monitoring the /health endpoint isn’t that interesting.
For a typical RESTful endpoint, we probably want to monitor number of requests and latencies for each request. As each data point is placed in a time series that should suffice for producing good metrics for API usage and performance.
To accomplish this, we want a SummaryVec produced per endpoint. Picking between summaries and histograms isn’t exactly easy, check this article for some more info.
Capturing metrics is performed by injecting a Go http.Handler using the middleware pattern (example). We’re using the most simple option where we chain handlers together, i.e:
// NewRouter creates a mux.Router and returns a pointer to it.
func NewRouter() *mux.Router {

	initQL(&LiveGraphQLResolvers{})

	muxRouter := mux.NewRouter().StrictSlash(true)

	for _, route := range routes {

        // create summaryVec for endpoint
		summaryVec := monitoring.BuildSummaryVec(route.Name, route.Method+" "+route.Pattern)

		// Add route to muxRouter, including middleware chaining and passing the summaryVec to the WithMonitoring func.
		muxRouter.Methods(route.Method).
			Path(route.Pattern).
			Name(route.Name).
			Handler(monitoring.WithMonitoring(withTracing(route.HandlerFunc, route), route, summaryVec)) // <-- CHAINING HERE!!!
	}

	logrus.Infoln("Successfully initialized routes including Prometheus.")
	return muxRouter
}
monitoring.BuildSummaryVec() is a factory function in our /goblog/common library that creates an SummaryVec instance and registers it with Prometheus, see code here. The Go Prometheus Client API can be a bit complex IMHO, though you should be fine if you follow their examples.
The monitoring.WithMonitoring() function is only invoked once, when setting up the middleware chain. It will either return the next handler if the route being processed declares that it doesn’t want monitoring, or the inlined http.Handler function declared after the if-statement:
func WithMonitoring(next http.Handler, route Route, summary *prometheus.SummaryVec) http.Handler {

    // Just return the next handler if route shouldn't be monitored
    if !route.Monitor {
        return next
    }

    return http.HandlerFunc(func(rw http.ResponseWriter, req *http.Request) {
       // impl coming up ...
    }
}
The implementation of our Prometheus monitoring middleware that will be executed on each call:
return http.HandlerFunc(func(rw http.ResponseWriter, req *http.Request) {
    start := time.Now()                    // Start time of the invocation
    next.ServeHTTP(rw, req)                // Invoke the next handler
    duration := time.Since(start)          // Record duration since start after the wrapped handler is done

    summary.WithLabelValues("duration").Observe(duration.Seconds())  // Store duration of request under the "duration" label.

    size, err := strconv.Atoi(rw.Header().Get("Content-Length"))     // Get size of response, if possible.
    if err == nil {
        summary.WithLabelValues("size").Observe(float64(size))       // If response contained Content-Length header, store under the "size" label.
    }
})
To sum things up, we’ve done the following with the codebase of our “accountservice”:
To speed things up a bit, there’s a new shell script as.sh one can use to quickly rebuild and redeploy the “accountservice”.
After build and redeploy, our “accountservice” should now have a /metrics endpoint. Try curl-ing http://192.168.99.100:6767/metrics
> curl http://192.168.99.100:6767/metrics

  # HELP go_gc_duration_seconds A summary of the GC invocation durations.
  # TYPE go_gc_duration_seconds summary
  go_gc_duration_seconds{quantile="0"} 5.6714e-05
  go_gc_duration_seconds{quantile="0.25"} 0.000197476
  ....
Out of the box, the Go Prometheus HTTP handler provides us with a ton of Go runtime statistics - memory usage, GC stats and CPU utilization. Note that we need to call our /accounts/{accountId} endpoint at least one time to get data for that endpoint:
> curl http://192.168.99.100:6767/accounts/10000
.... response from the endpoint ...

> curl http://192.168.99.100:6767/metrics
# HELP accountservice_GetAccount GET /accounts/{accountId}
# TYPE accountservice_GetAccount summary
accountservice_GetAccount{service="duration",quantile="0.5"} 0.014619157
accountservice_GetAccount{service="duration",quantile="0.9"} 0.018249754
accountservice_GetAccount{service="duration",quantile="0.99"} 0.156361284
accountservice_GetAccount_sum{service="duration"} 0.8361315079999999
accountservice_GetAccount_count{service="duration"} 44
accountservice_GetAccount{service="size",quantile="0.5"} 293
...
There they are! One can note the naming convention used, e.g: [namespace][route name]*{[label1]=[“labelvalue1”],..}, we’ll get back to how these names and labels are used in the Query DSL later in the Prometheus or Grafana GUI:s.
If everything works out, we should now have an “accountservice” producing metrics which the Prometheus Server knows where to scrape. Let’s open up the Prometheus GUI at http://192.168.99.100:9090 again and execute our first query. To get some data, I’ve run a simple script that calls the /accounts/{accountId} endpoint with 3 req/s.
We’ll do two simple Prometheus queries and use the graphing functionality in Prometheus Server to display the result.
We’ll start with just counting the total number of requests. We’ll do this by the following query:
accountservice_GetAccount_count{service="duration"}
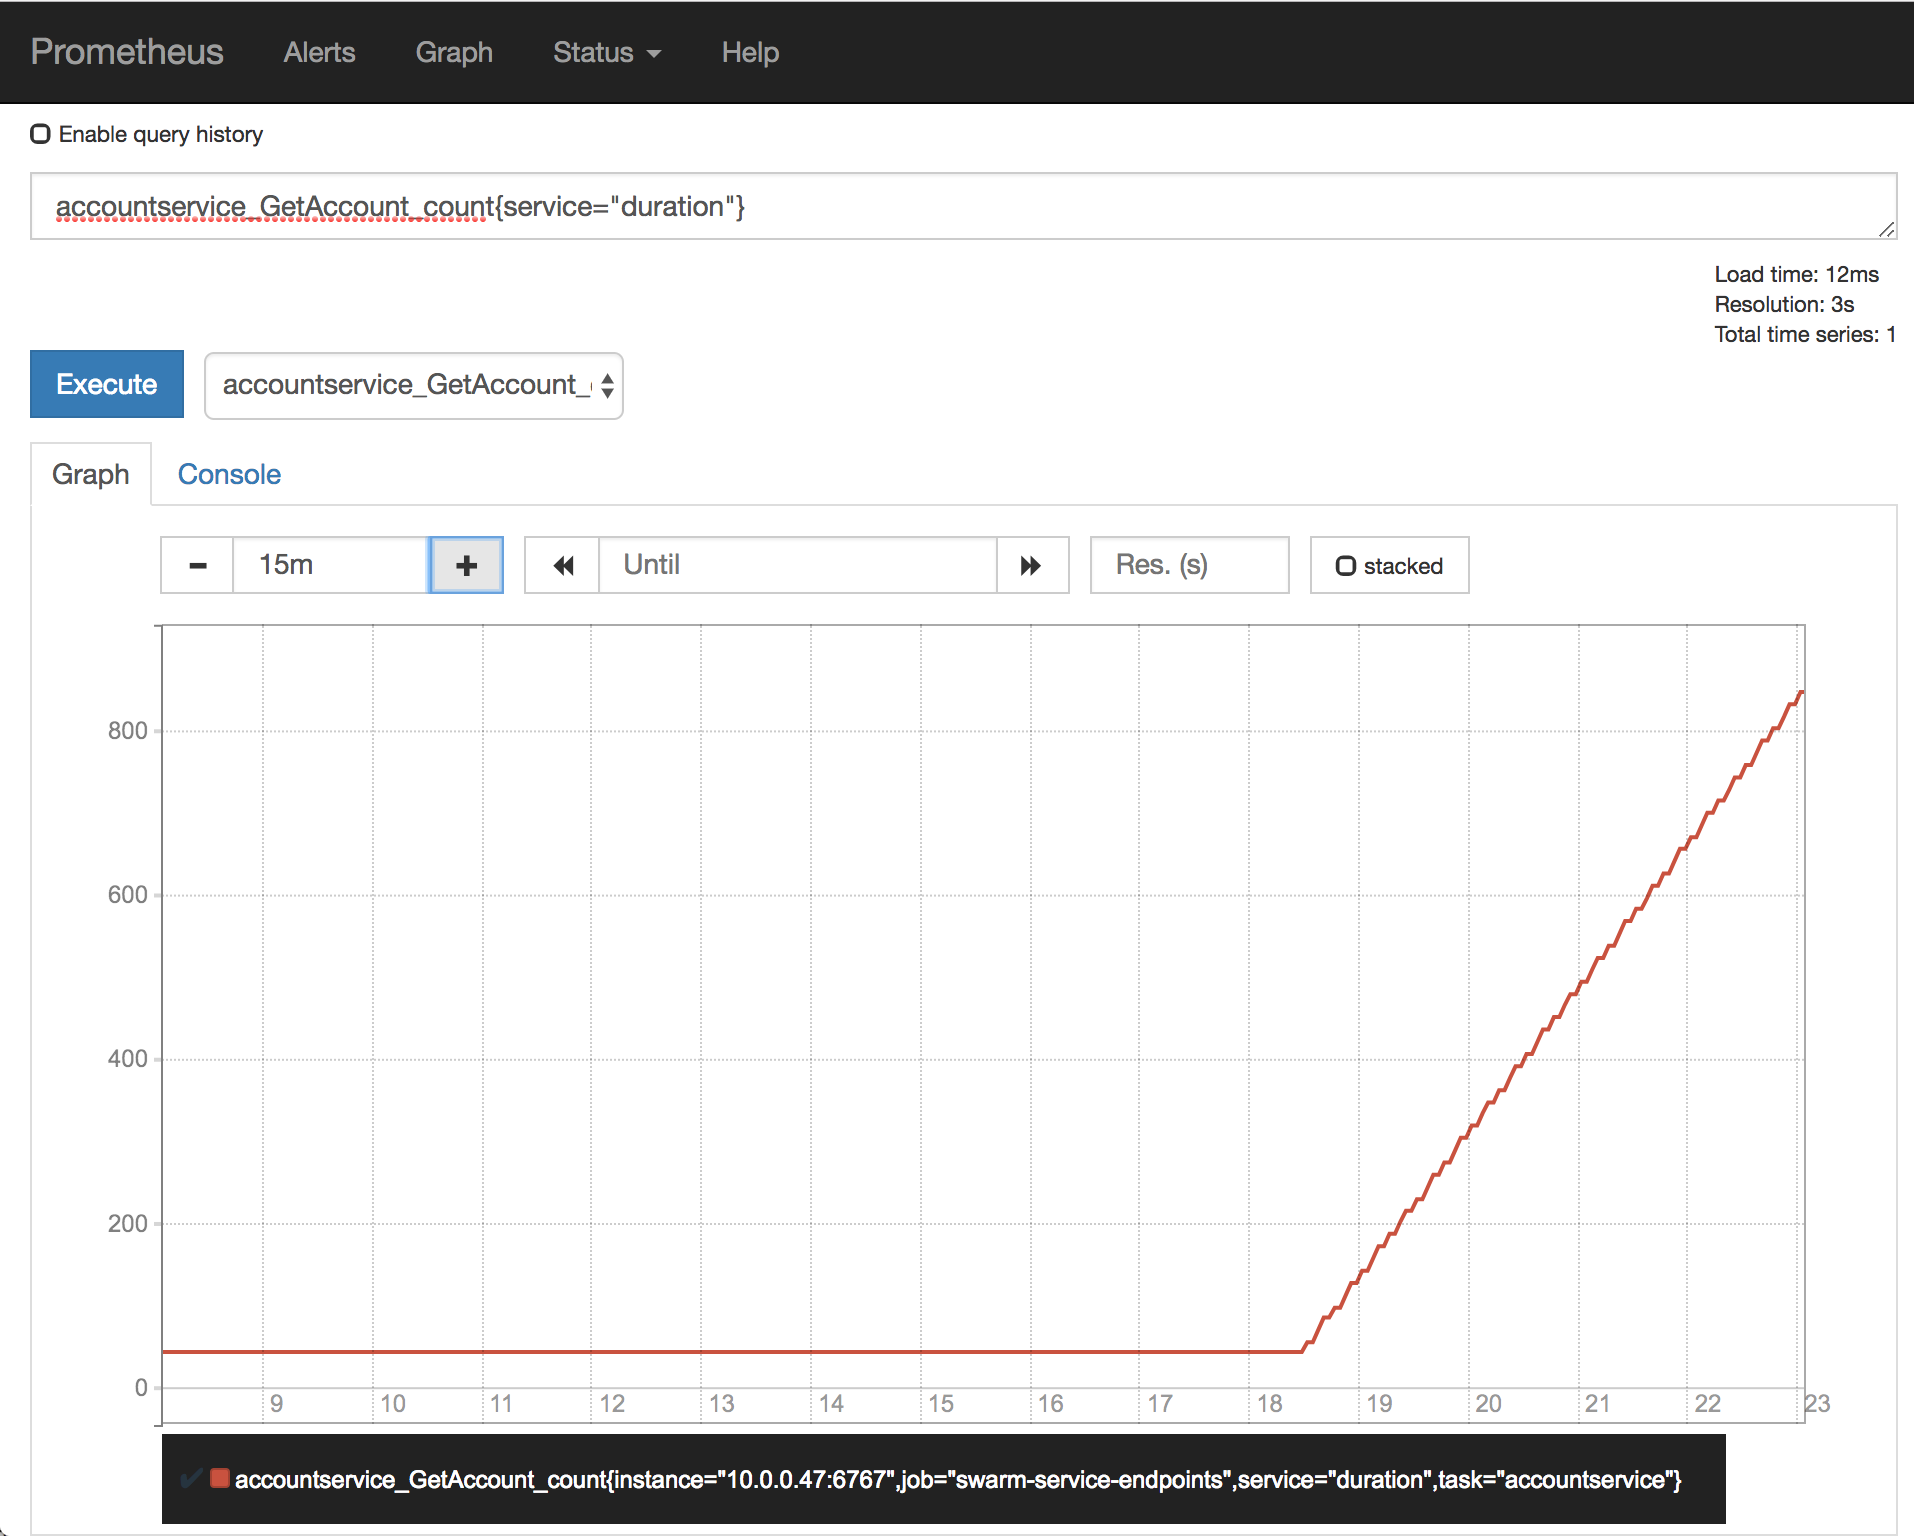
This just plots our linearly increasing (we’re running 3 req/s) count for the GetAccount route.
Let’s enter the following into the query field, where we select all quantiles for the “accountservice_GetAccount” having the “duration” label. We multiply the result by 1000 to convert from seconds into milliseconds.
accountservice_GetAccount{service="duration"} * 1000
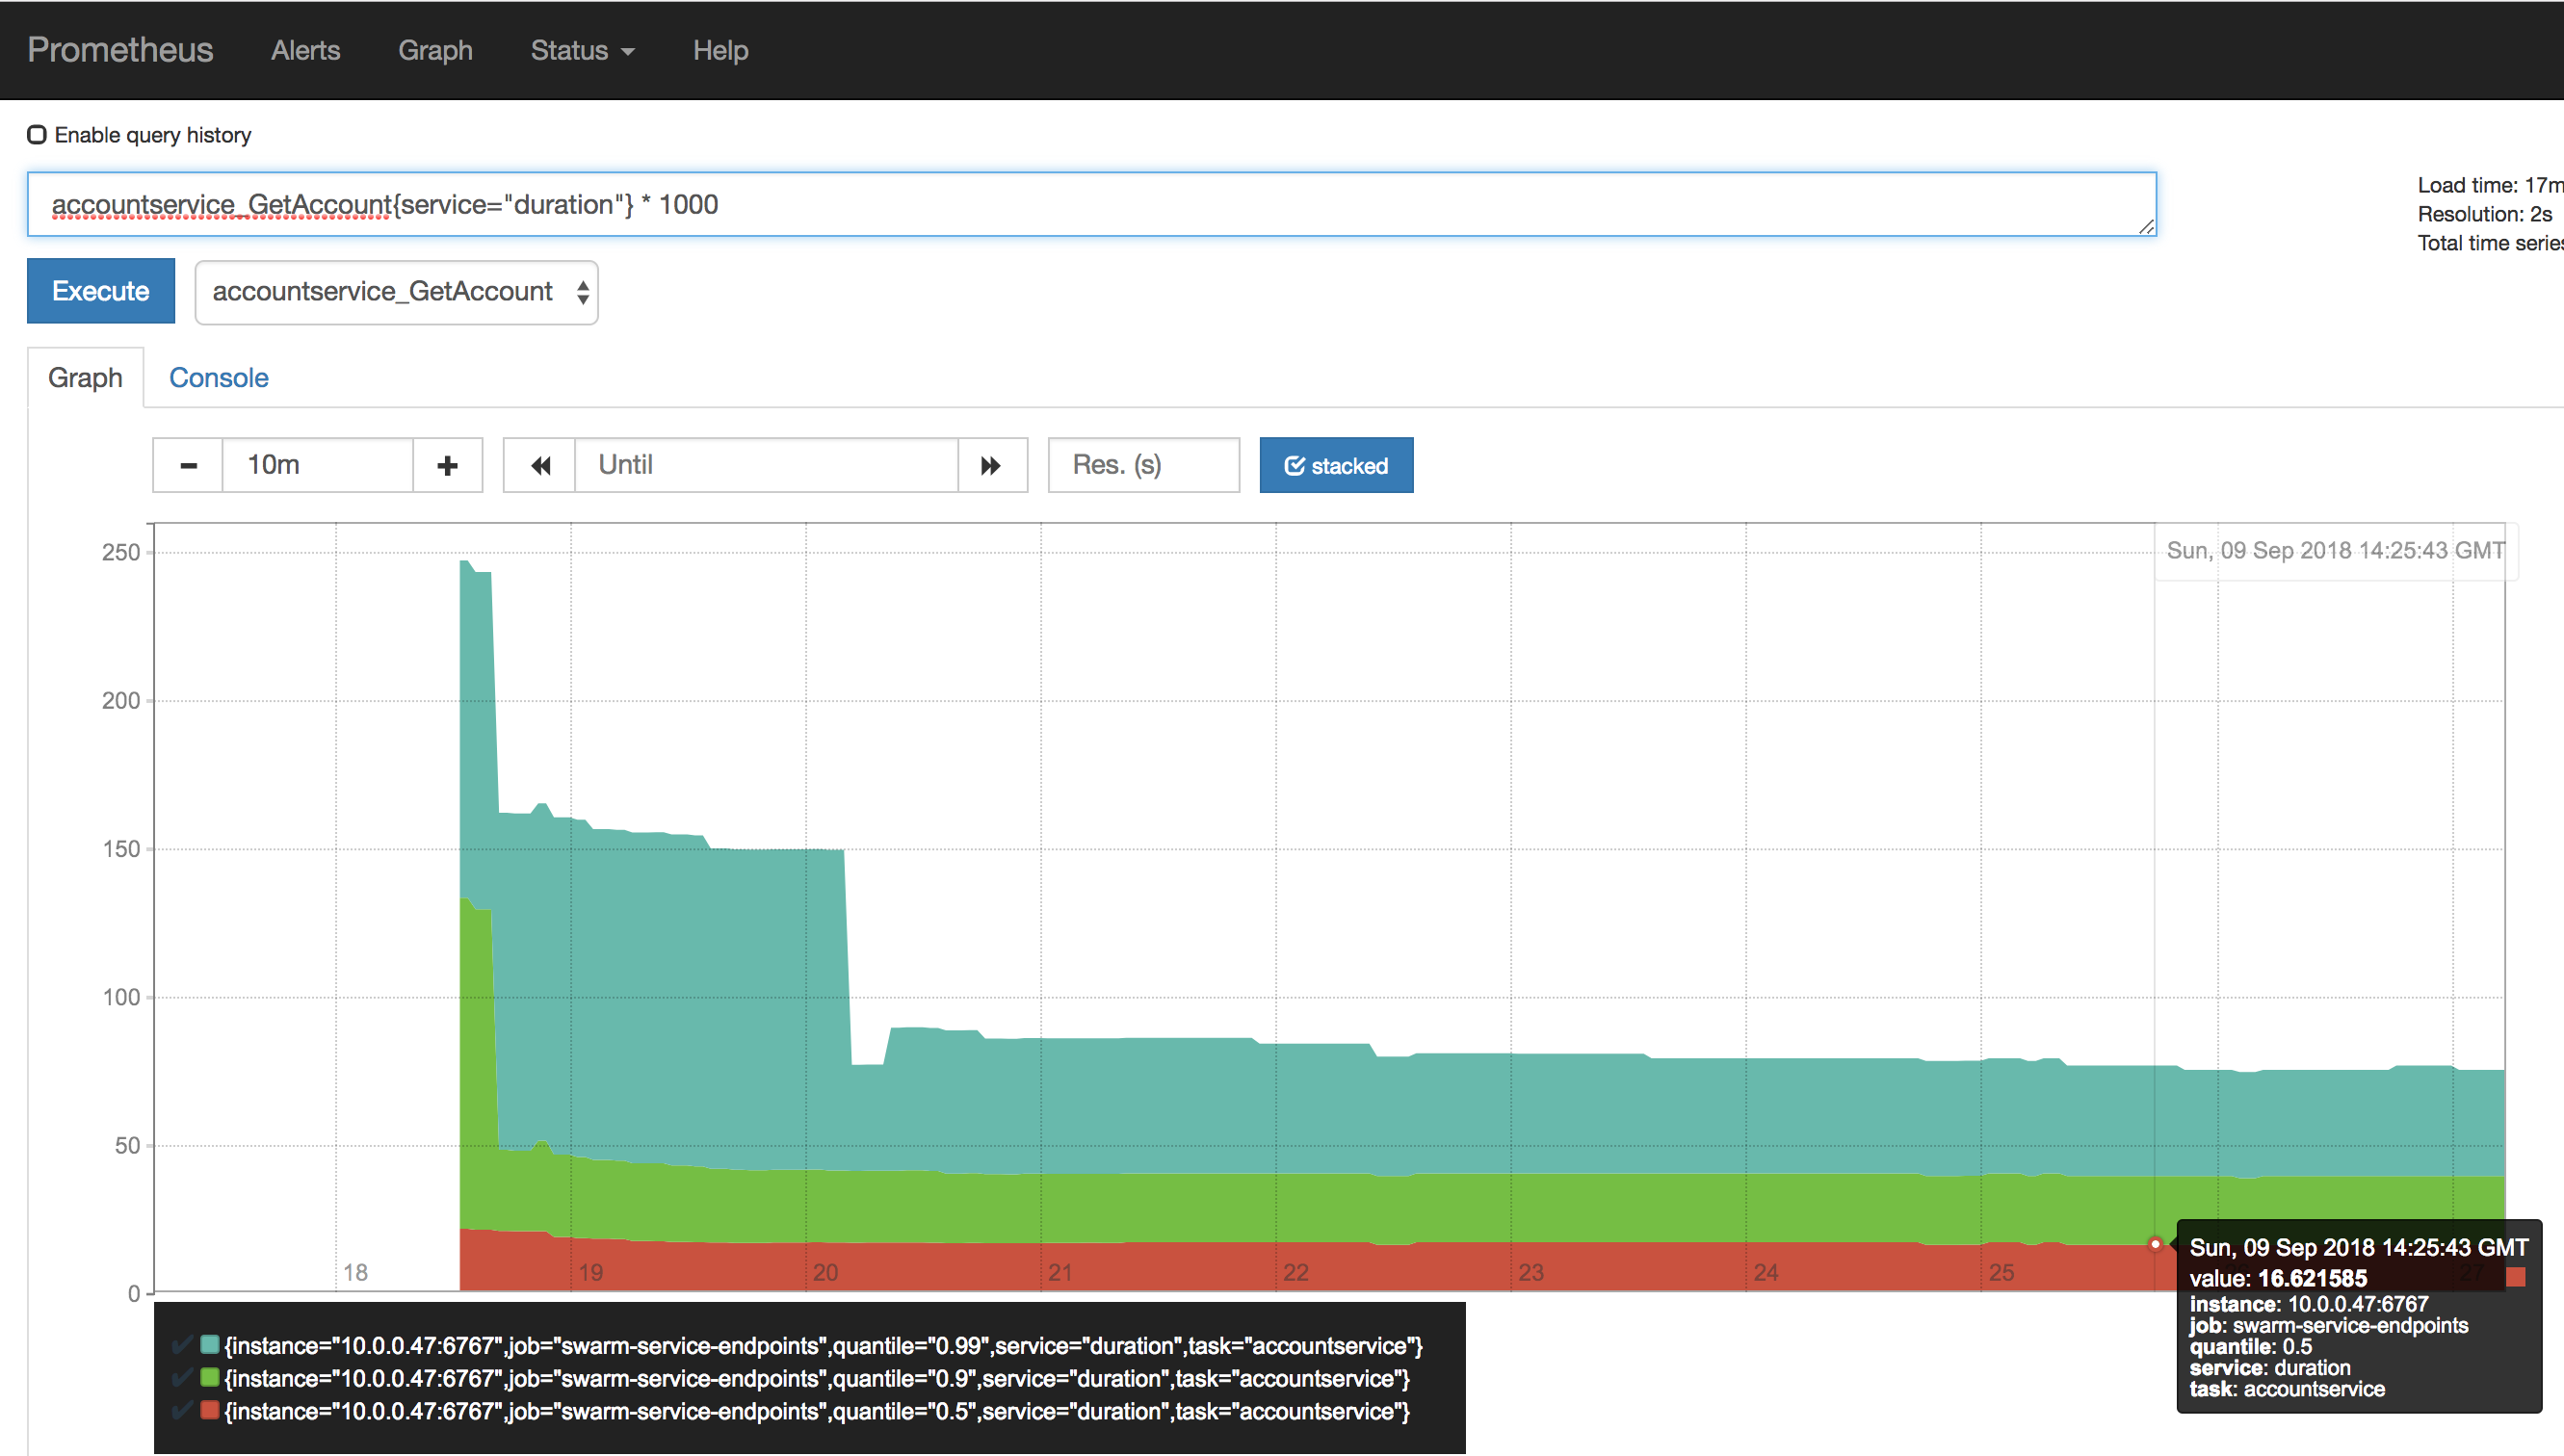
I’ve selected the “stacked” visualization option and it’s quite easy to see that our 50th percentile (e.g. avg) sits at about 16ms while the 99th percentile duration is approx 80 ms.
The Prometheus GUI can do more, but for more eye-appealing visualizations we’ll continue by getting Grafana up and running and configured to use our Prometheus server as datasource.
Grafana is a platform for visualization and analytics of time series data. It’s used for many purposes, visualization of Prometheus metrics is just one of many and fully describing the capabilties of Grafana is definitely out of the scope of this blog post.
We’ll do the following:
For the purpose of this blog post, we’ll run Grafana without persistence etc which makes it a breeze to set up:
> docker service create -p 3000:3000 --constraint node.role==manager --name=grafana --replicas=1 --network=my_network grafana/grafana
Wait until it’s done and fire up your web browser at http://192.168.99.100:3000. Grafana will prompt you to change your password and then take you to its Dashboard:
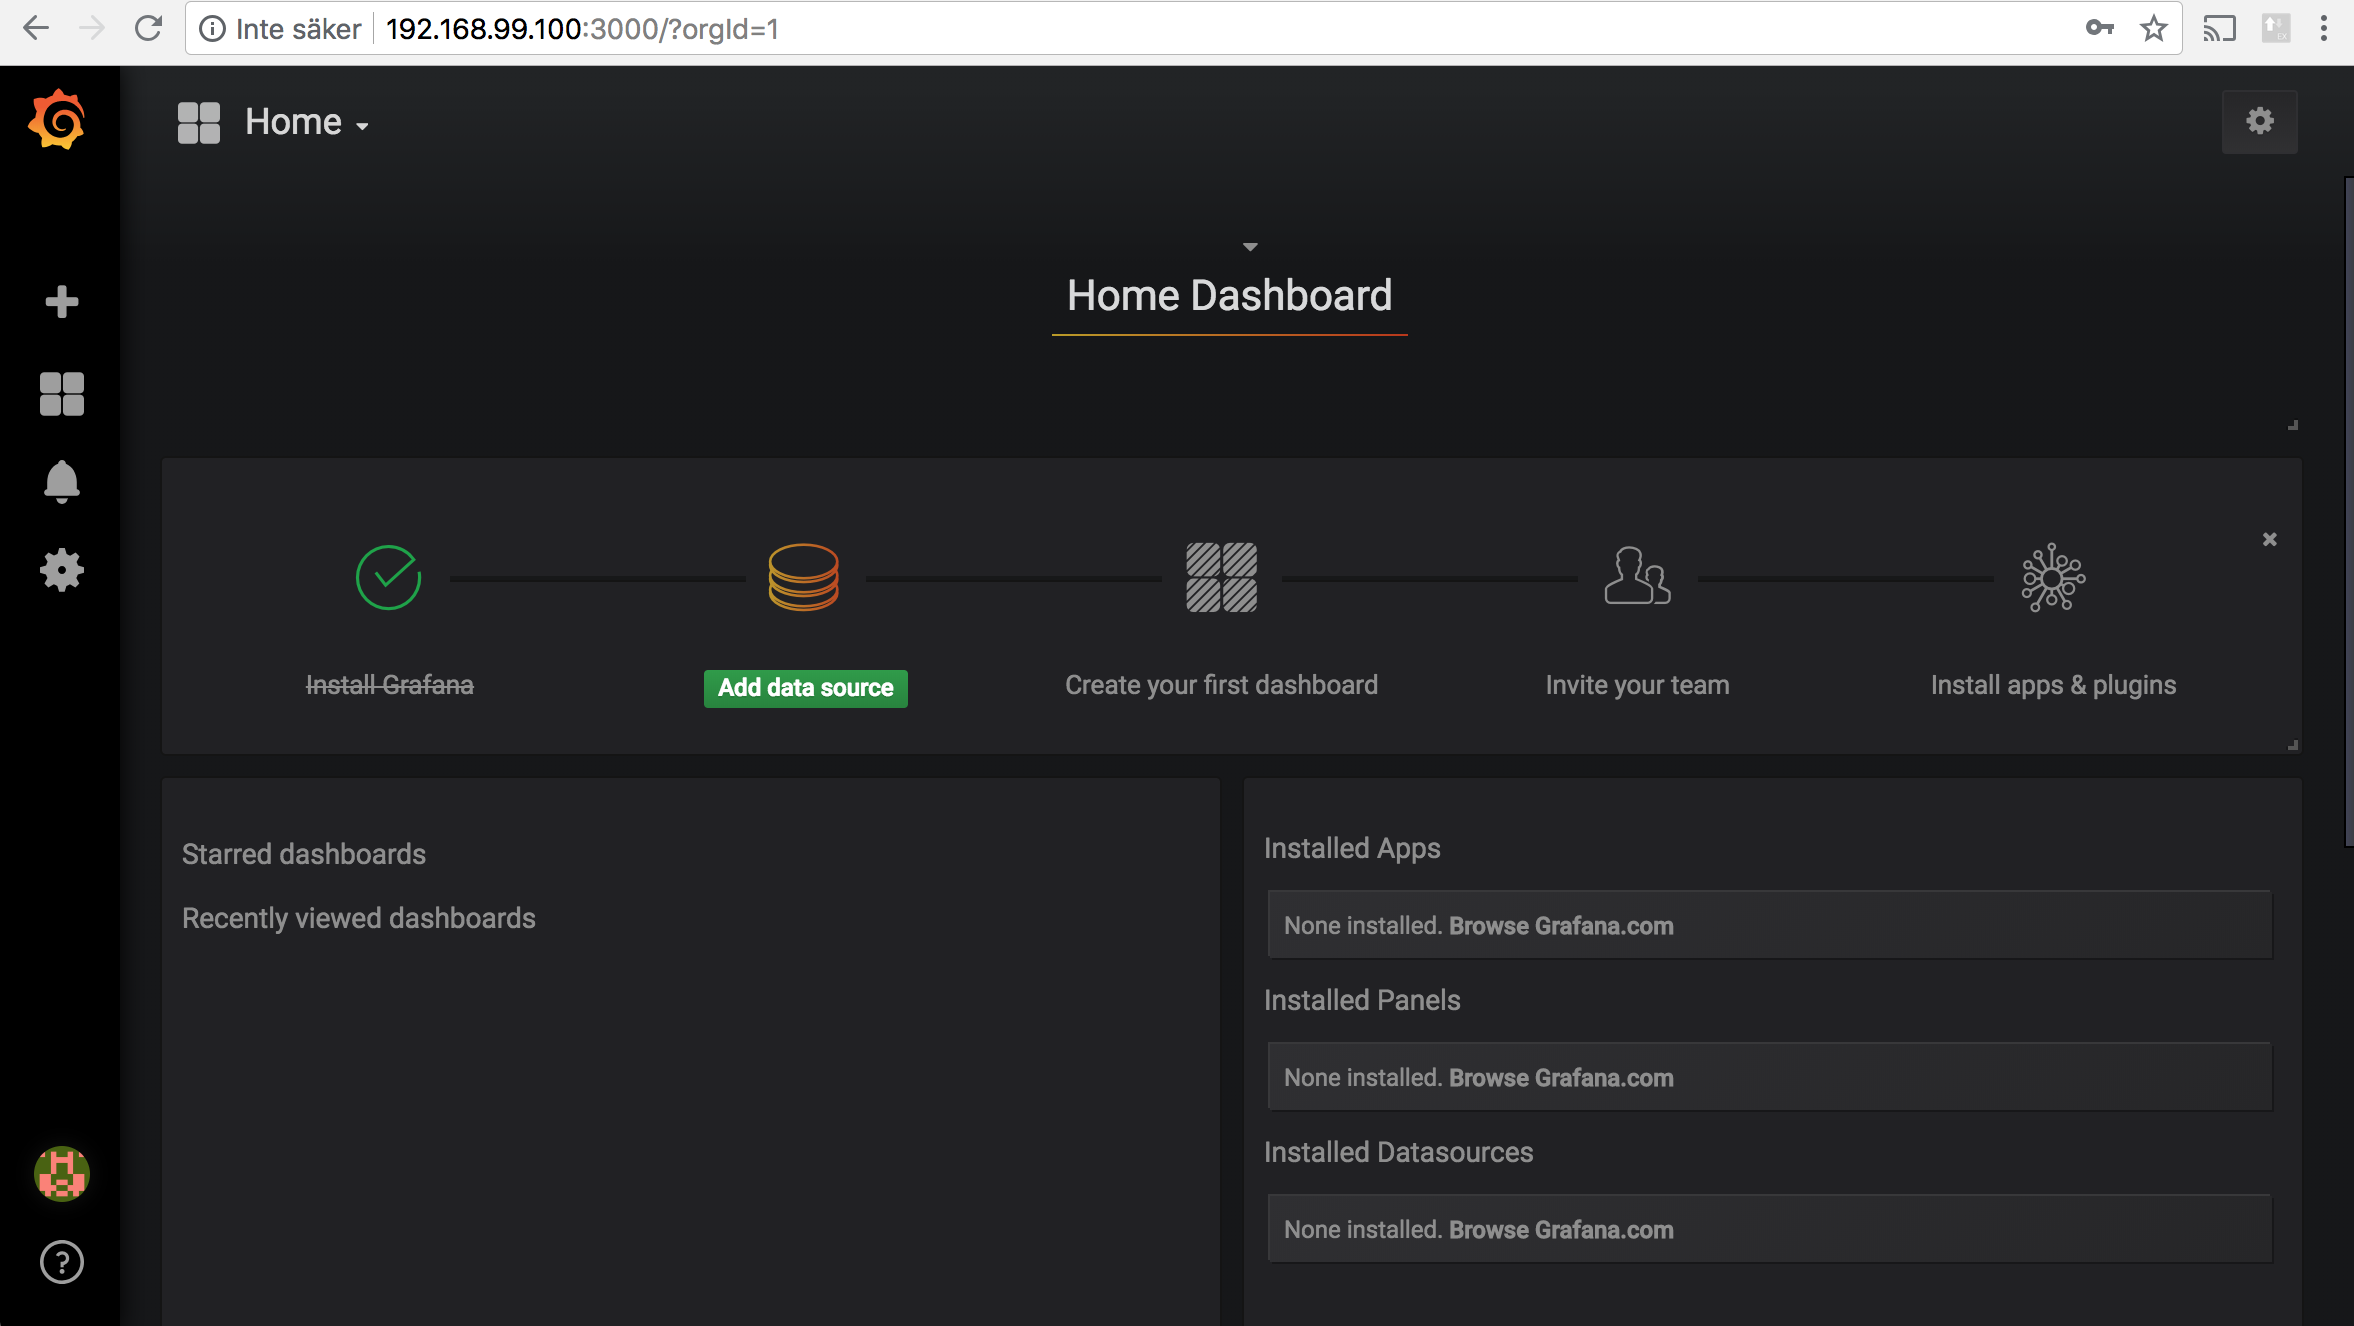
Note that we’re running Grafana without any persistent storage. In a real setup, you’d set it up properly so your user(s) and reports survives a cluster restart!
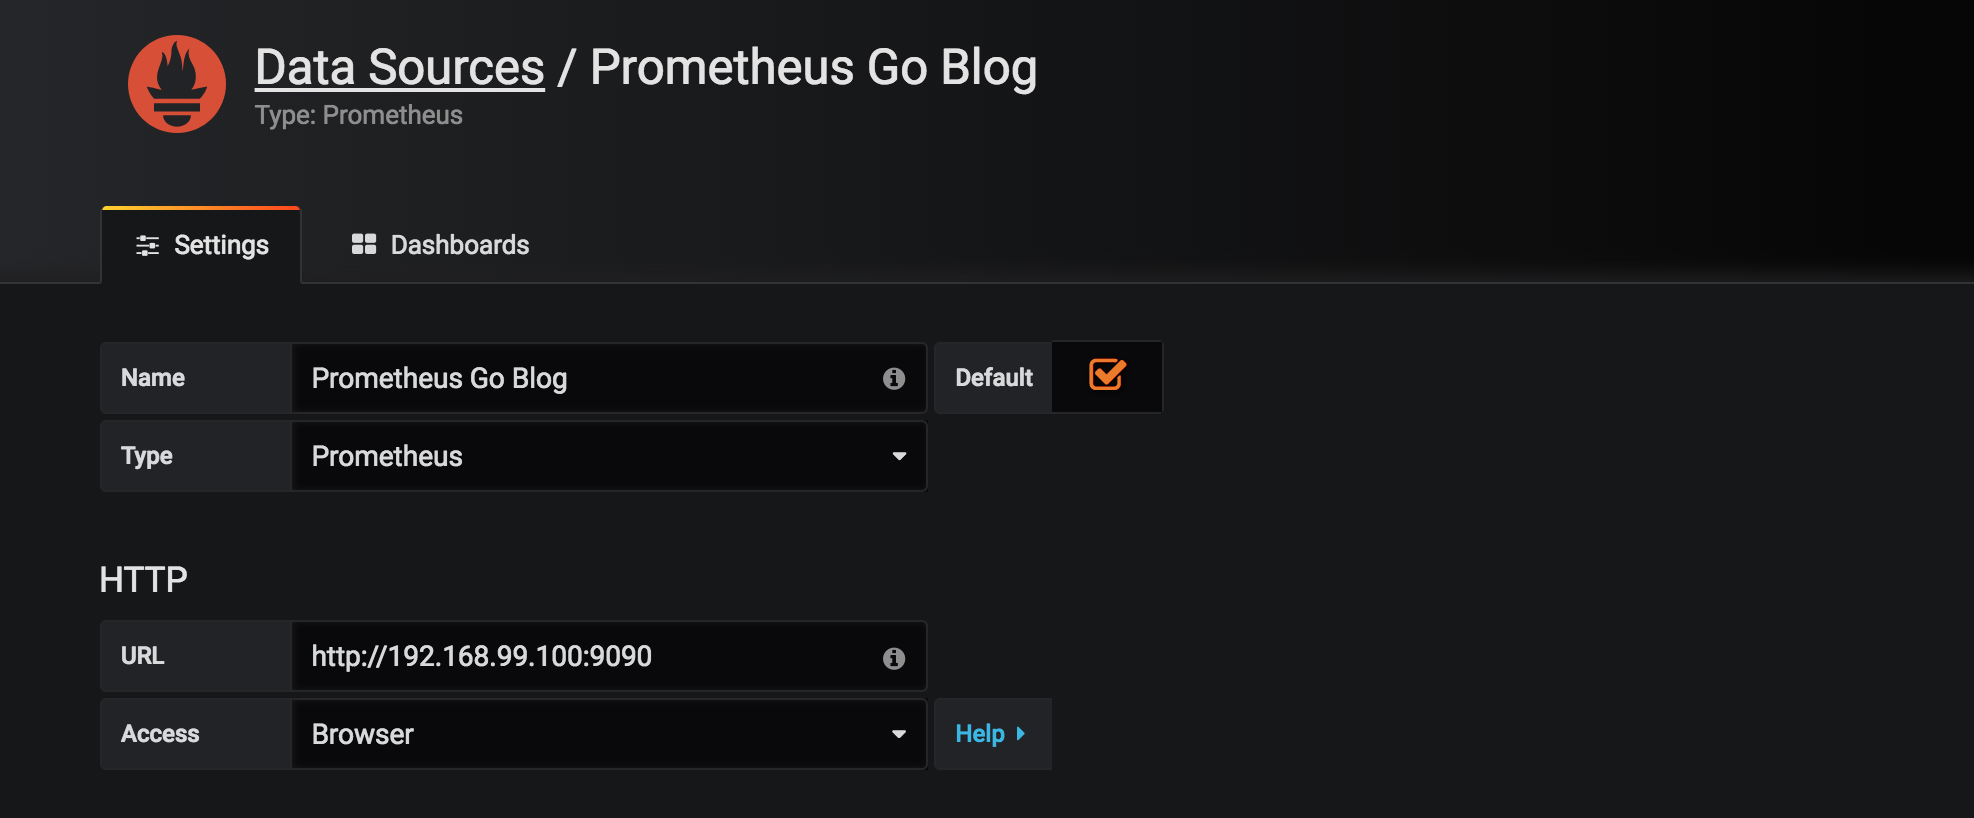
Click the “Add datasource” button and enter http://192.168.99.100:9090 as server URL. Note that we’ll using “Browser” access which means that Grafana will communicate with the Prometheus server through your browser as proxy. It sort-of works using Server-mode with http://prometheus:9090 as URL (which is how it should be done), but I keep getting issues with queries just refusing to complete so I’d recommend using browser-mode when just trying things out.
Click the plus(+) button in the upper-left and then select “Graph” as panel type. Next, click the chevron on “Panel title” and select “Edit” in the drop-down menu. You should see something such as:
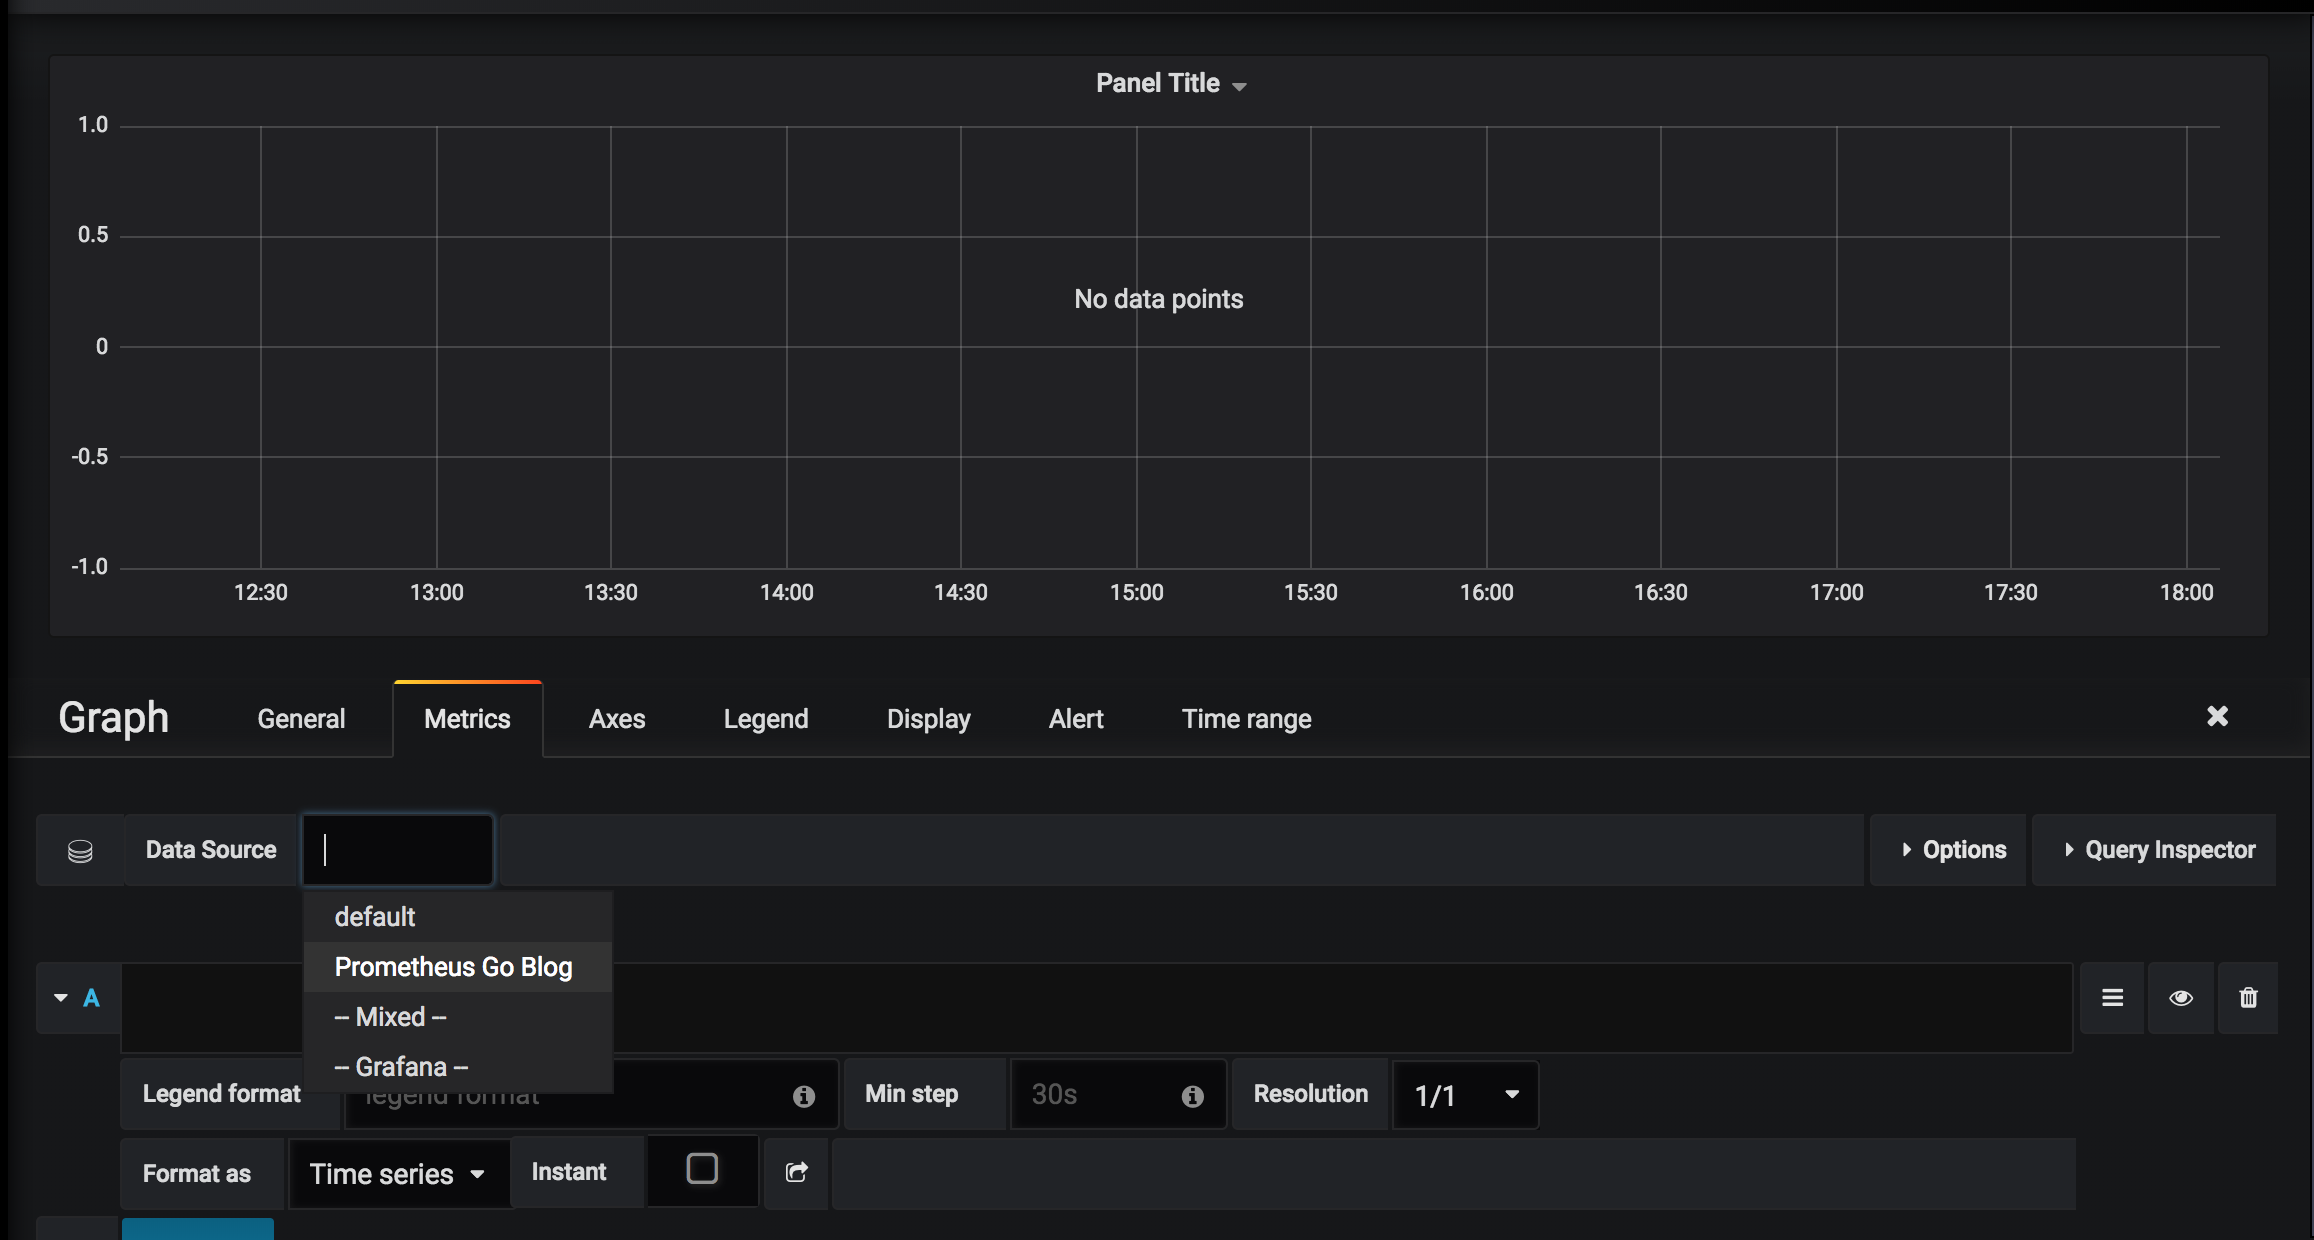
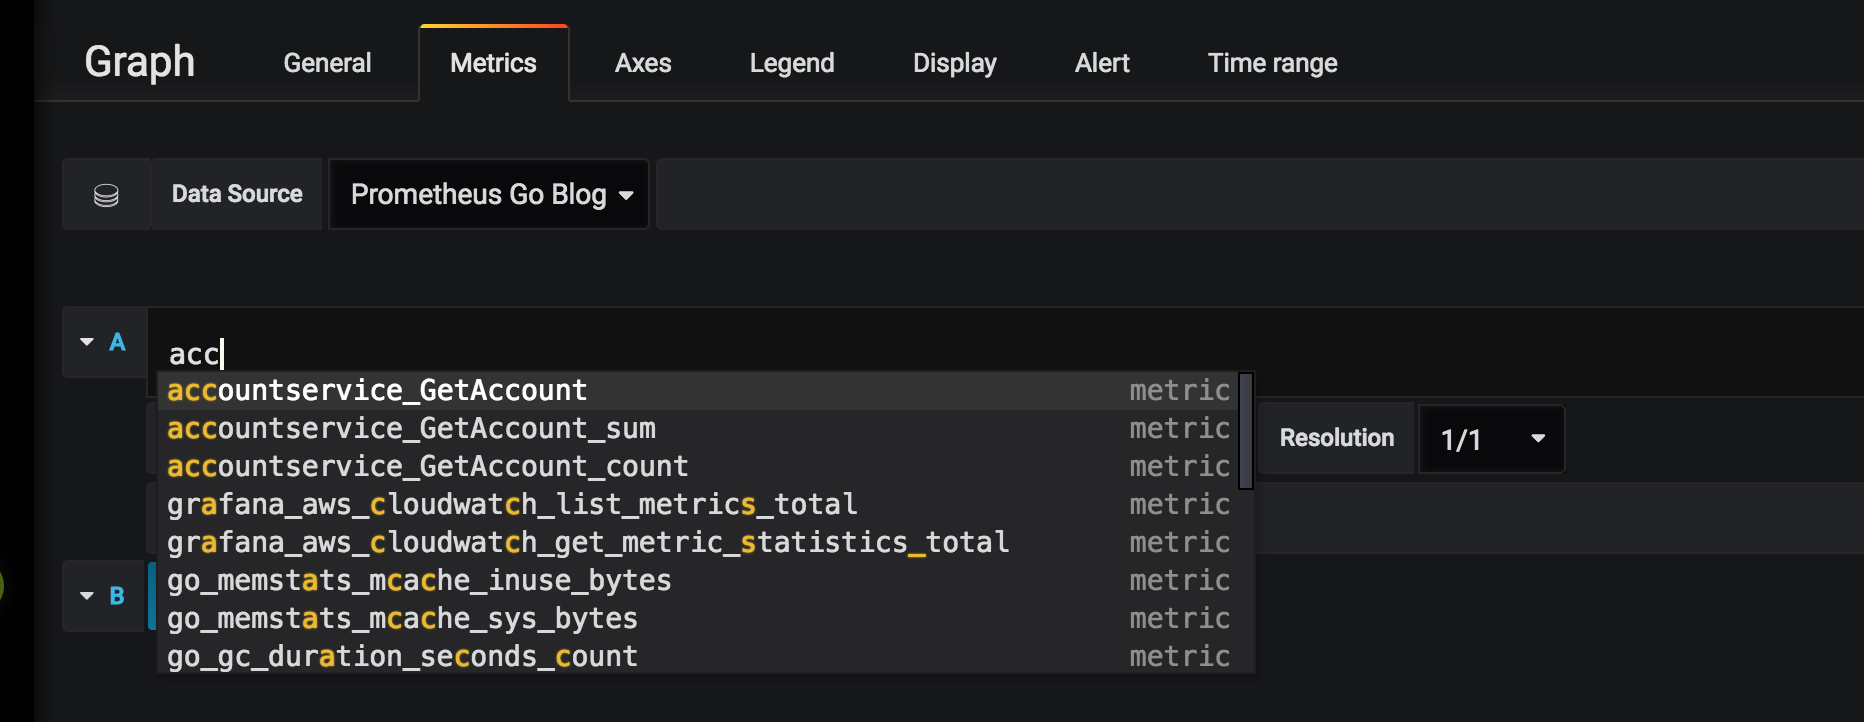
As you can see, you should select our “Prometheus Go” datasource from the Data Source drop-down. We should now be able to write our first query, using the same query language as we used in section 5.
If you start typing in the Query field, you’ll get code-completion to help you get started. In the image below, I’ve typed “acc” which immediately results in a number of things we could add to our dashboard.
Grafana is very powerful, with an overwhelming amount of options and capabilties for creating graphs, dashboards and analytics. There are people and blogs better suited to digging into exquisite details and graph skills, so I’ll settle for describing the queries used for creating a dashboard with two panels. Both show the system running three instances of the “accountservice” under a light load.
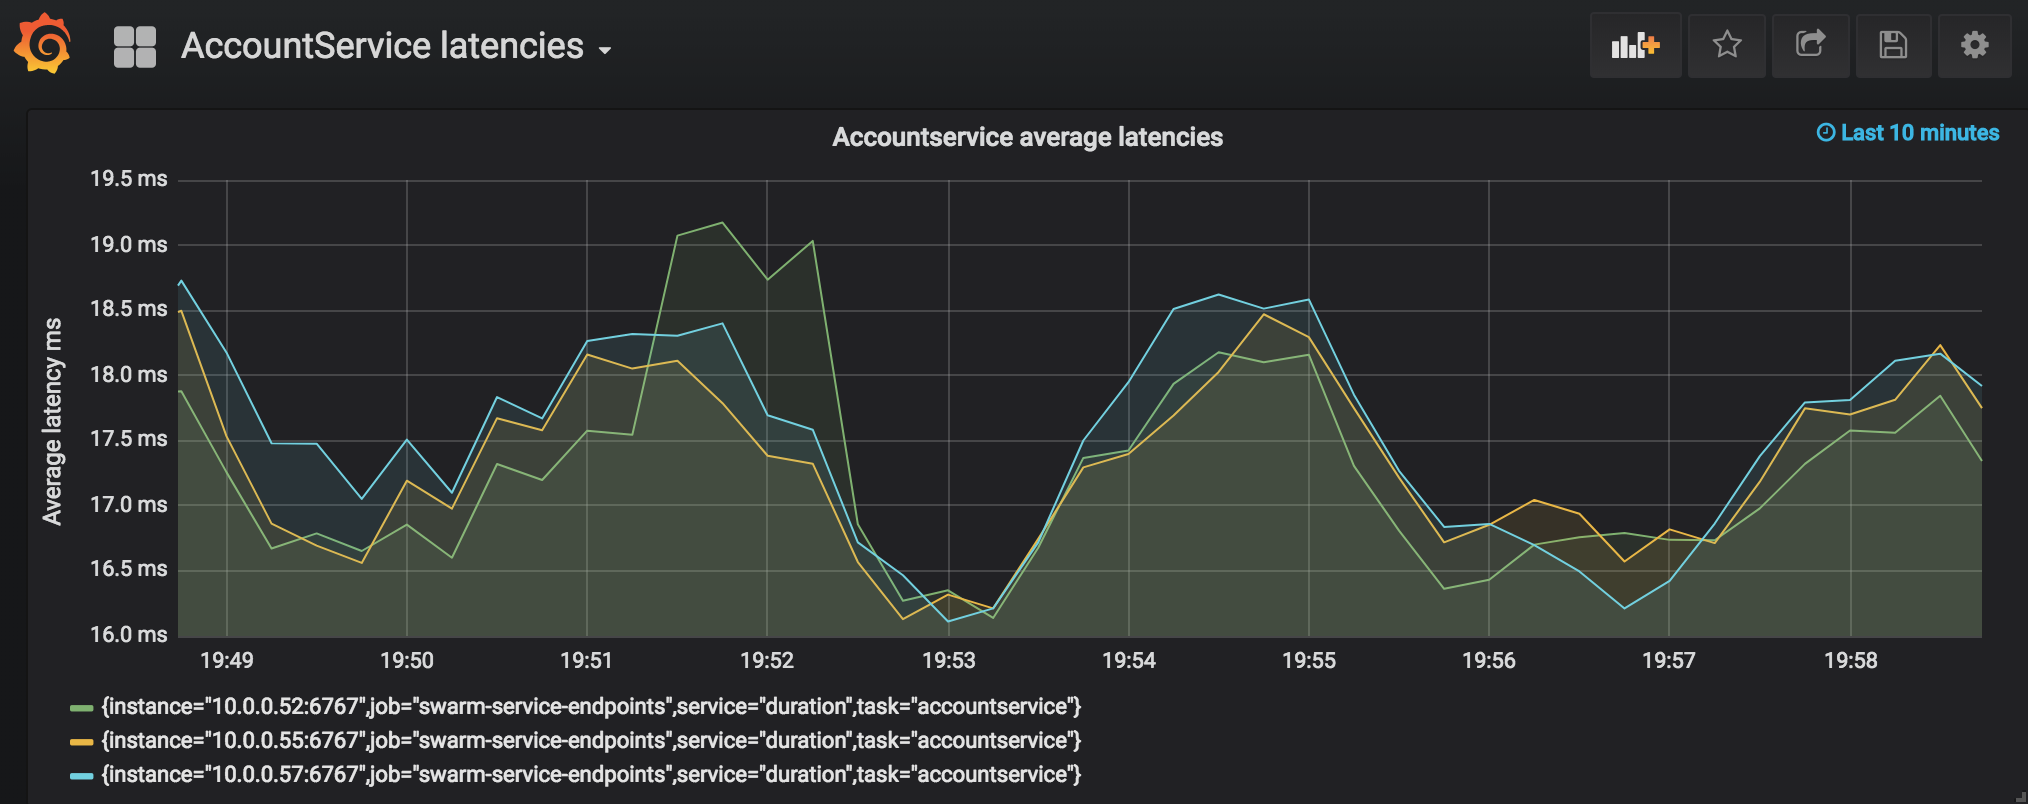
For the average latencies we’ll use the following query:
avg_over_time(accountservice_GetAccount_sum{service="duration"}[1m]) /
avg_over_time(accountservice_GetAccount_count{service="duration"}[1m])
* 1000
The avg_over_time() function allows us to specify the time window during which we want to aggregate values in the time series, one minute in this case. To get the average, we’re dividing the sum of latencies by the count which gets us the average, finally multiplying by 1000 to get the result in milliseconds instead of fractions of a second.
Due to the broken y-axis the results seem to fluctuate a lot, but is actually within approx 16-19 ms.
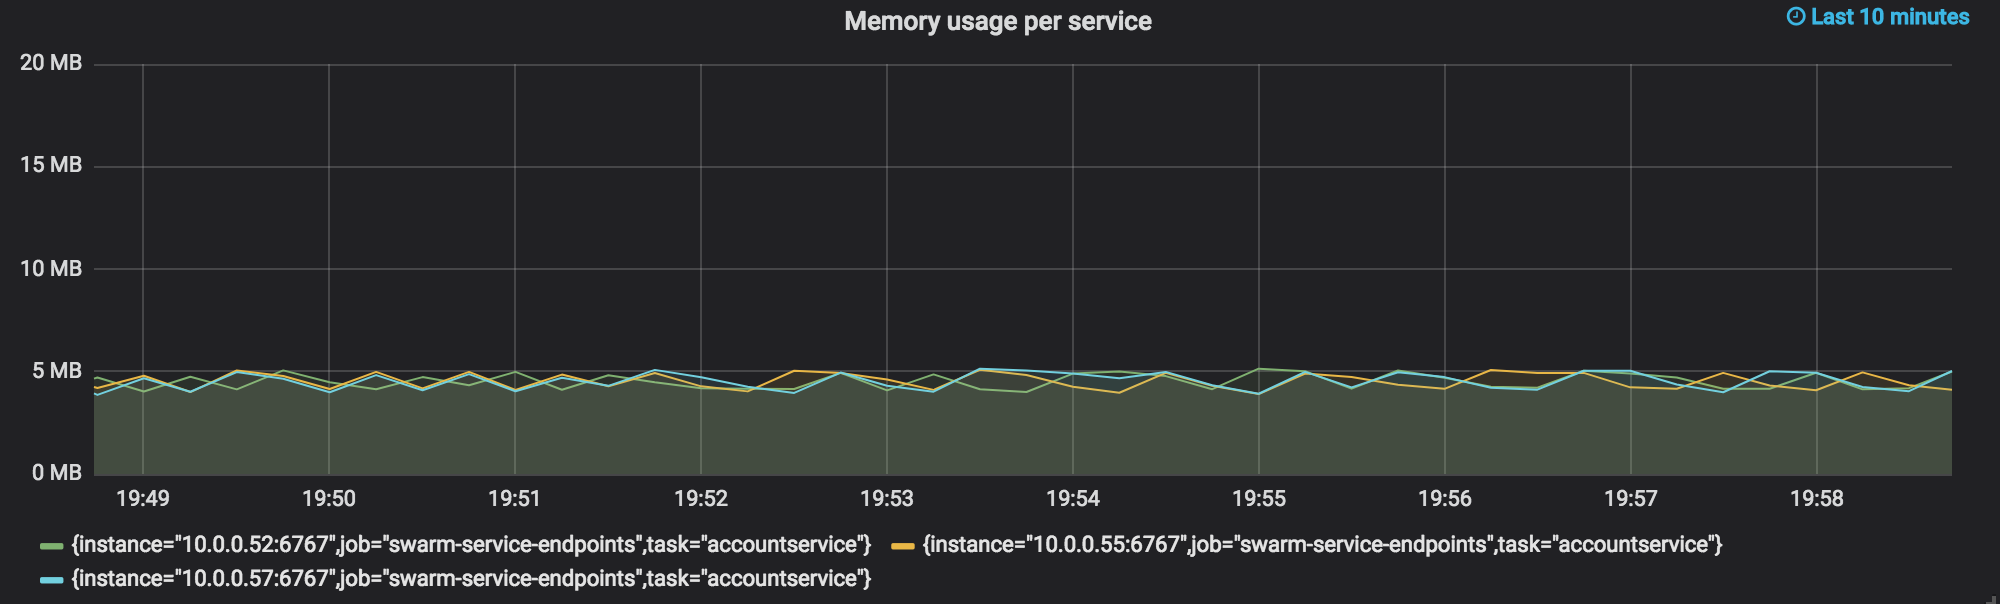
Memory utilization is a classic metric in the world of monitoring. The default http.Handler from Prometheus automatically exposes this as a Gauge metric we can use in a Grafana dashboard. The query looks like this:
go_memstats_heap_inuse_bytes{task="accountservice"} / 1000000
We see our three instances of the “Accountservice” hovering around the 5 mb mark.
As previously stated, Grafana offers great possibilities for visualizing and analyzing monitoring data exposed by the equally capable Prometheus ecosystem, whose finer details is out of scope for this (already too long…) blog post.
In this part of the blog series we’ve finally added monitoring, where Prometheus (Go client lib + server) and Grafana was our stack of choice. We’ve accomplished the following:
In the next part, we’ll do a major refactoring of the codebase to better comply with contemporary and idiomatic Go coding guidelines and patterns.
Please help spread the word! Feel free to share this blog post using your favorite social media platform, there’s some icons below to get you started.
Until next time,
// Erik