Blogg
Här finns tekniska artiklar, presentationer och nyheter om arkitektur och systemutveckling. Håll dig uppdaterad, följ oss på Twitter
Här finns tekniska artiklar, presentationer och nyheter om arkitektur och systemutveckling. Håll dig uppdaterad, följ oss på Twitter

In this blog post I will describe how to set up a local Kubernetes cluster for test purposes with a minimal memory usage and fast startup times, using Docker in Docker instead of traditional local virtual machines.
This blog post is part of the blog series - Trying out new features in Docker.
For a background on how Docker in Docker can help us to set up a local Kubernetes cluster, see the Background section in the blog post Setting up a Docker Swarm cluster using Docker in Docker.
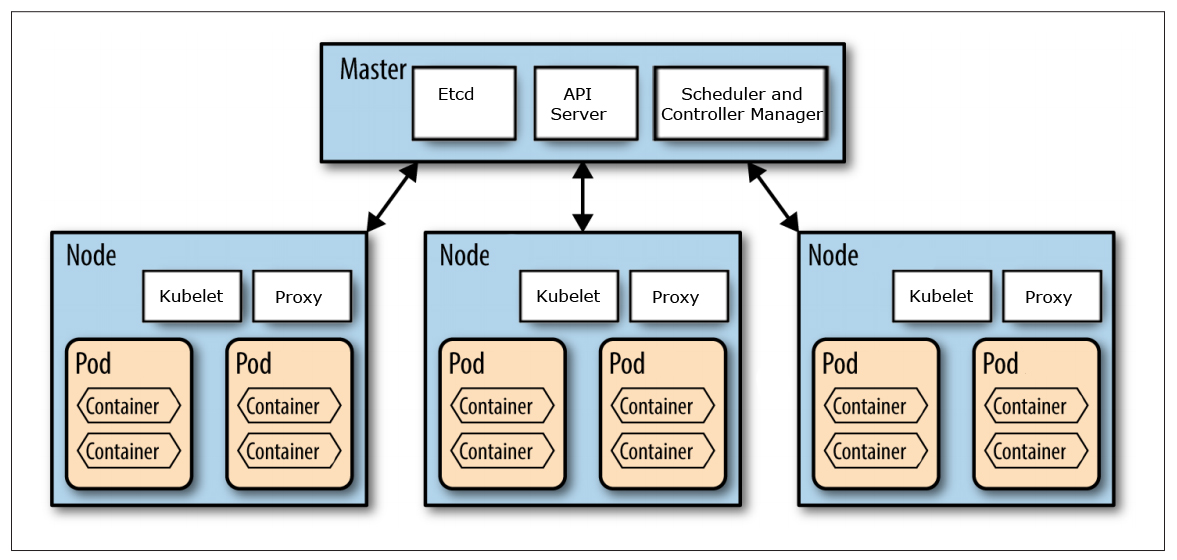
This blog post is not an introduction to Kubernetes and the components that builds up a Kubernetes cluster. For an introduction of the concepts used in Kubernetes see: kubernetes.io/docs/concepts/.
We are going to use the GitHub project Mirantis/kubeadm-dind-cluster to set up a Kubernetes cluster using Docker in Docker and we will use Docker for Mac to act as the Docker Host for the Kubernetes nodes (running as containers in Docker for Mac).
 Source: http://nishadikirielle.blogspot.se/2016/02/kubernetes-at-first-glance.html
First, you need to have Docker for Mac installed, I’m on version 17.09.1-ce-mac42.
Next, you also need to have jq and md5sha1sum installed to be able to follow my instructions below.
If you use Homebrew, they can be installed with:
brew install jq
brew install md5sha1sum
Finally, clone the Git repo Mirantis/kubeadm-dind-cluster from GitHub and jump into the fixed folder:
git clone https://github.com/Mirantis/kubeadm-dind-cluster.git
cd kubeadm-dind-cluster/fixed
We are good to go!
Start up a Kubernetes v1.8 cluster requesting 3 worker nodes in the cluster (default is 2):
NUM_NODES=3 ./dind-cluster-v1.8.sh up
The first time the up command is executed it will take a few minutes and produce lot of output in the terminal window…
…in the end it should say something like:
NAME          STATUS    ROLES     AGE       VERSION
kube-master   Ready     master    2m        v1.8.4
kube-node-1   Ready     <none>    1m        v1.8.4
kube-node-2   Ready     <none>    1m        v1.8.4
kube-node-3   Ready     <none>    47s       v1.8.4
* Access dashboard at: http://localhost:8080/ui
Note: If you start up the cluster again later on, it will only take a minute.
Verify that you can see the master and worker nodes as ordinary containers in Docker for Mac:
docker ps
It should report something like:
CONTAINER ID        IMAGE                                COMMAND                  CREATED             STATUS              PORTS                      NAMES
766582a93d1f        mirantis/kubeadm-dind-cluster:v1.8   "/sbin/dind_init s..."   9 hours ago         Up 9 hours          8080/tcp                   kube-node-3
e1fc6bec1f23        mirantis/kubeadm-dind-cluster:v1.8   "/sbin/dind_init s..."   9 hours ago         Up 9 hours          8080/tcp                   kube-node-2
b39509b9db77        mirantis/kubeadm-dind-cluster:v1.8   "/sbin/dind_init s..."   9 hours ago         Up 9 hours          8080/tcp                   kube-node-1
a01be2512423        mirantis/kubeadm-dind-cluster:v1.8   "/sbin/dind_init s..."   9 hours ago         Up 9 hours          127.0.0.1:8080->8080/tcp   kube-master
Ok, so let’s see if we actually have a Kubernetes cluster up and running:
kubectl get nodes
It should result in a response like:
NAME          STATUS    AGE       VERSION
kube-master   Ready     2m        v1.8.4
kube-node-1   Ready     55s       v1.8.4
kube-node-2   Ready     1m        v1.8.4
kube-node-3   Ready     1m        v1.8.4
Also try out Kubernetes Dashboard at: localhost:8080/ui
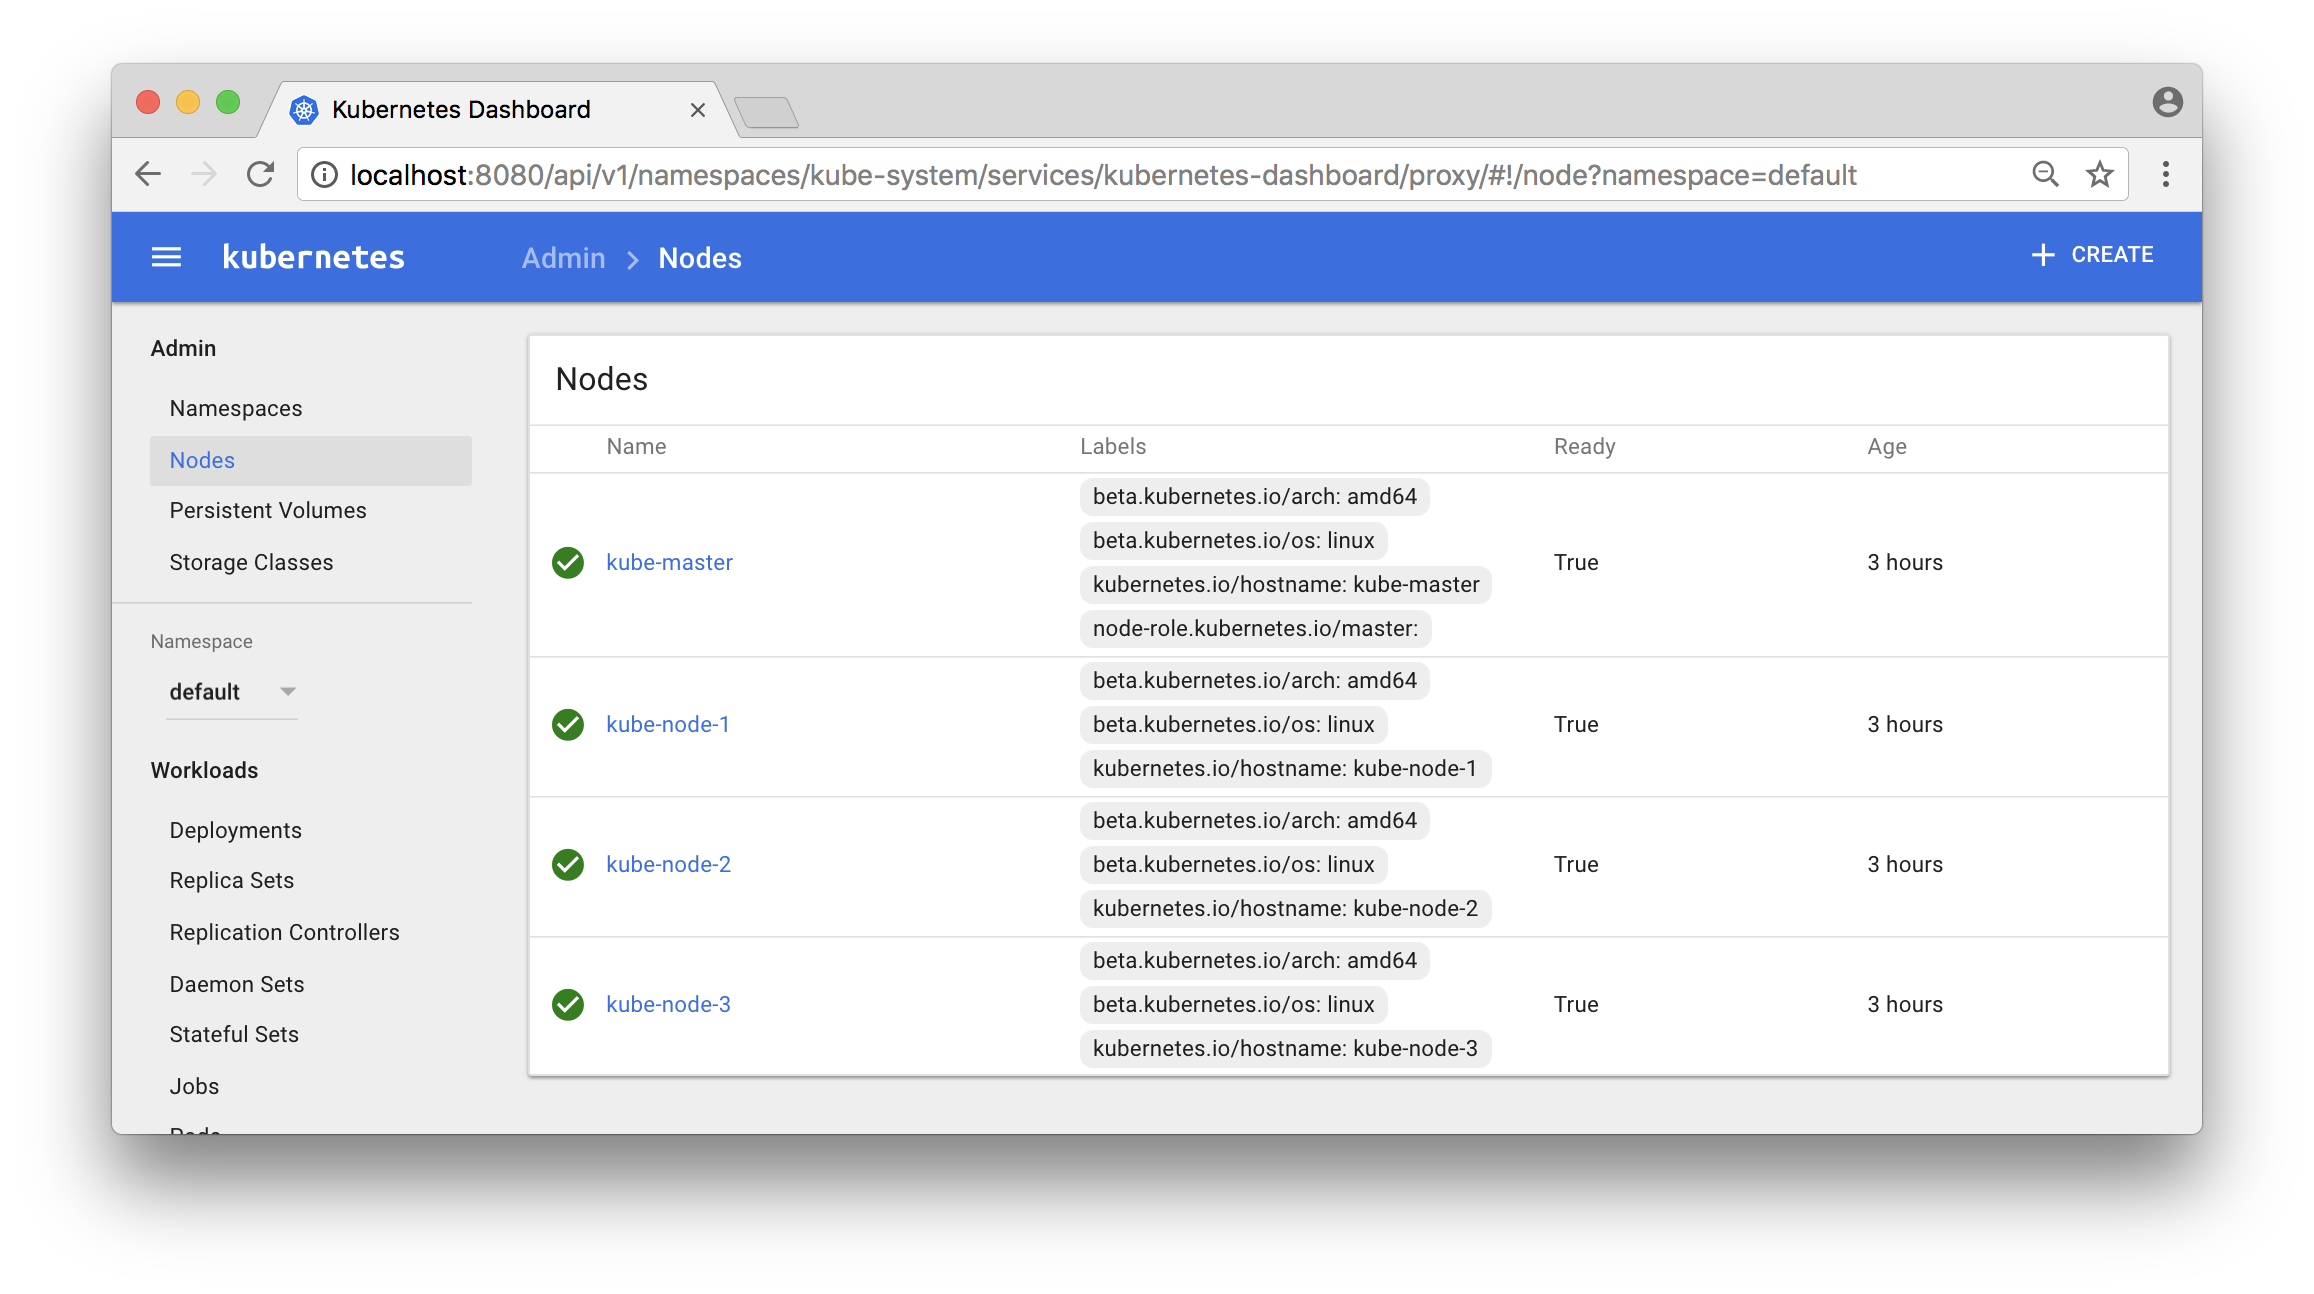
Click on the “Nodes” - link in the menu to the left and you should see something like:
Now, let’s deploy a service and try it out!
I have a very simple Docker image magnuslarsson/quotes:go-22 (written in Go) that creates some random quotes about successful programming languages.
We will create a Deployment of this Docker Image and a Service that expose it on each node in the Kubernetes cluster using a dedicated port (31000). The creation of the Deployment object will automatically also create a Replica Set and a Pod.
Note: In more production like environment we should also set up an external load balancer, like HAProxy or NGINX in front of the Kubernetes cluster to be able to expose one single entry point to all services in the cluster. But that is out of scope for this blog post and left as an exercise for the interested reader :-)
First, switch to the default namespace:
kubectl config set-context $(kubectl config current-context) --namespace=default
The default namespace should only contain one pre-created object, run the command:
kubectl get all
It should report:
NAME             CLUSTER-IP   EXTERNAL-IP   PORT(S)   AGE
svc/kubernetes   10.96.0.1    <none>        443/TCP   5h
Create a file named quotes.yml with the following command:
cat <<EOF > quotes.yml
apiVersion: apps/v1beta1
kind: Deployment
metadata:
  name: quotes
  labels:
    app: quotes-app
spec:
  replicas: 1
  selector:
    matchLabels:
      app: quotes-app
  template:
    metadata:
      labels:
        app: quotes-app
    spec:
      containers:
      - name: quotes
        image: magnuslarsson/quotes:go-22
        ports:
        - containerPort: 8080
---

apiVersion: v1
kind: Service
metadata:
  name: quotes-service
spec:
  type: NodePort
  selector:
    app: quotes-app
  ports:
    - port: 8080
      targetPort: 8080
      nodePort: 31000
EOF
Create the Deployment and Service objects with the following command:
kubectl create -f quotes.yml
Verify that we got the expected objects created, using the following command:
kubectl get all
Expect output:
NAME                         READY     STATUS    RESTARTS   AGE
po/quotes-77776b5bbc-5lll7   1/1       Running   0          45s

NAME                 CLUSTER-IP       EXTERNAL-IP   PORT(S)          AGE
svc/kubernetes       10.96.0.1        <none>        443/TCP          5h
svc/quotes-service   10.105.185.117   <nodes>       8080:31000/TCP   45s

NAME            DESIRED   CURRENT   UP-TO-DATE   AVAILABLE   AGE
deploy/quotes   1         1         1            1           45s

NAME                   DESIRED   CURRENT   READY     AGE
rs/quotes-77776b5bbc   1         1         1         45s
Note: In the output above short names are used for object types:
po: Podsvc: Servicedeploy: Deploymentrs: Replica Set
We can now try it out using curl from one of the worker nodes:
docker exec kube-node-2 curl localhost:31000/api/quote -s -w "\n" | jq
Output should look like:
{
  "ipAddress": "quotes-77776b5bbc-5lll7/10.192.3.4",
  "quote": "In Go, the code does exactly what it says on the page.",
  "language": "EN"
}
The most interesting part of the response from the service is actually the field ipAddress, that contains the hostname and ip address of the pod that served the request, quotes-77776b5bbc-5lll7/10.192.3.4 in the sample response above.
This can be used to verify that scaling of a service actually works. In the output from a scaled service we expect different values in the ipAddress - field from subsequent requests, indicating that the request is load balanced over the available pods.
Let’s try it out, shall we?
First, start a loop that use curl to sends one request per second to the quote-service and prints out the ipAddress - field from the response:
while true; do docker exec kube-node-2 curl localhost:31000/api/quote -s -w "\n" | jq -r .ipAddress; sleep 1; done
Initially the output should return one and the same hostname and IP address, since we only have one pod running in the service:
quotes-77776b5bbc-5lll7/10.192.3.4
quotes-77776b5bbc-5lll7/10.192.3.4
quotes-77776b5bbc-5lll7/10.192.3.4
quotes-77776b5bbc-5lll7/10.192.3.4
Now, scale the quote-service by adding 8 new pods to it (9 in total):
kubectl scale --replicas=9 deployment/quotes
Verify that you can see all 9 quote-service pods and also to what node they are deployed:
kubectl get pods -o wide
Expected output:
NAME                      READY     STATUS    RESTARTS   AGE       IP            NODE
quotes-77776b5bbc-42wgk   1/1       Running   0          1m        10.192.4.9    kube-node-3
quotes-77776b5bbc-c8mkf   1/1       Running   0          1m        10.192.3.8    kube-node-2
quotes-77776b5bbc-dnpm8   1/1       Running   0          25m       10.192.3.4    kube-node-2
quotes-77776b5bbc-gpk85   1/1       Running   0          1m        10.192.2.8    kube-node-1
quotes-77776b5bbc-qmspm   1/1       Running   0          1m        10.192.4.11   kube-node-3
quotes-77776b5bbc-qr27h   1/1       Running   0          1m        10.192.3.9    kube-node-2
quotes-77776b5bbc-txpcq   1/1       Running   0          1m        10.192.2.9    kube-node-1
quotes-77776b5bbc-wb2qt   1/1       Running   0          1m        10.192.4.10   kube-node-3
quotes-77776b5bbc-wzhzz   1/1       Running   0          1m        10.192.2.7    kube-node-1
Note: We got three pods per node, as expected!
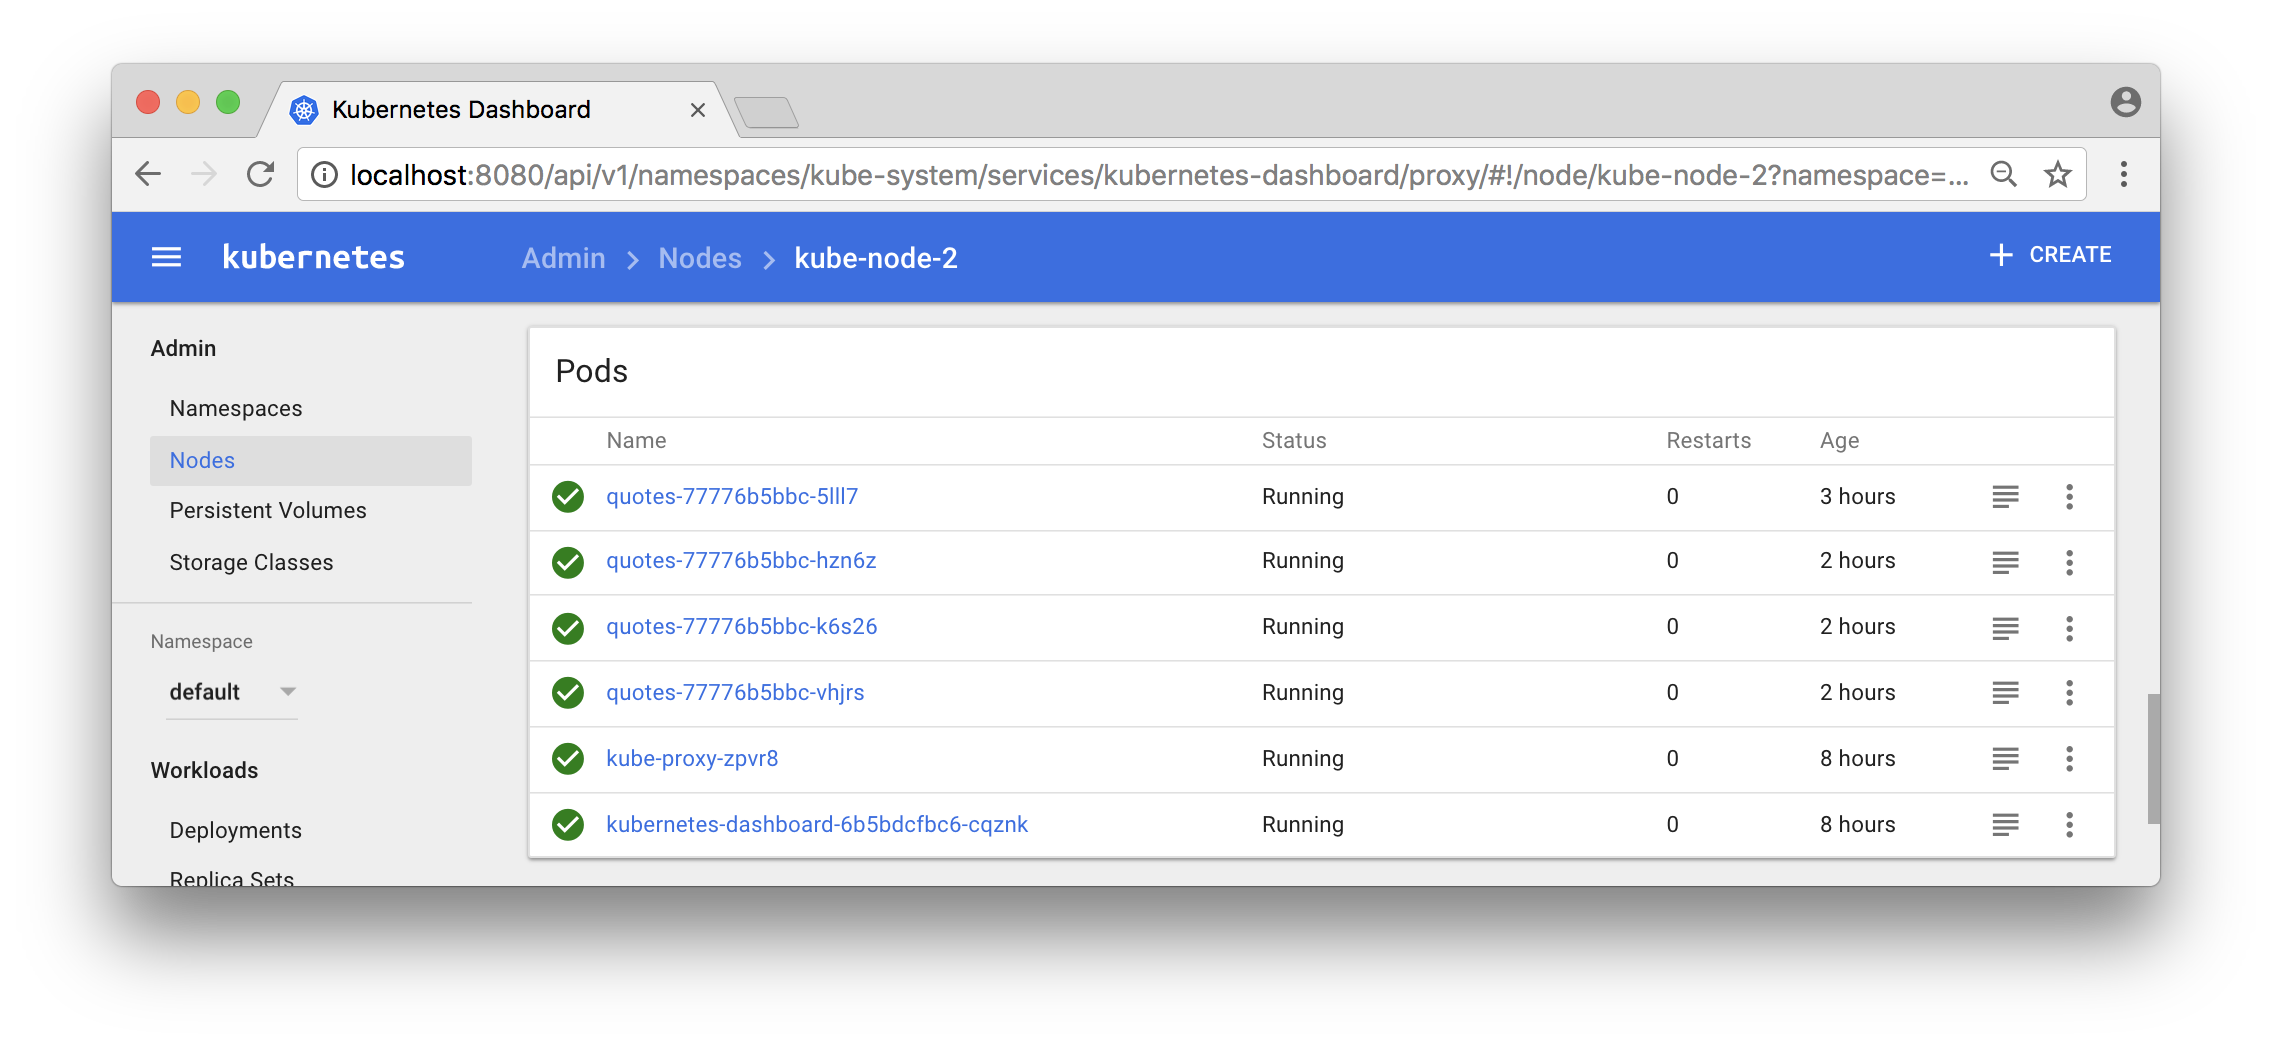
You can also use the Dashboard to see what pods that run in a specific node:
Now, the output from the curl - loop should report different hostnames and ip addresses as the requests are load balanced over the 9 pods:
quotes-77776b5bbc-gpk85/10.192.2.8
quotes-77776b5bbc-42wgk/10.192.4.9
quotes-77776b5bbc-txpcq/10.192.2.9
quotes-77776b5bbc-txpcq/10.192.2.9
quotes-77776b5bbc-wb2qt/10.192.4.10
quotes-77776b5bbc-txpcq/10.192.2.9
Great, isn’t it?
Now, let’s expose the container orchestrator, i.e. Kubernetes, to some problems and see if it handles them as expected!
First, let’s shut down some arbitrary pods and see if the orchestrator detects it and start new ones!
Note: We will actually kill the container that runs within the pod, not the pod itself.
Start a long running command, using the --watch flag, that continuously reports changes in the state of the Deployment object:
kubectl get deployment quotes --watch
Initially, it should report:
NAME      DESIRED   CURRENT   UP-TO-DATE   AVAILABLE   AGE
quotes    9         9         9            9           1d
Note: The command hangs, waiting for state changes to be reported
To keep things relatively simple, let’s kill all quote-services running on the first worker node:
CIDS=$(docker exec kube-node-1 docker ps --filter name=k8s_quotes_quotes -q)
docker exec kube-node-1 docker rm -f $CIDS
The command should respond with the ids of the killed containers:
e780545ddd17
ddd260ba3f73
b4e07e736028
Now, go back to the “deployment watch” - command and see what output it produces!
It should be something like:
quotes    9         9         9         8         1d
quotes    9         9         9         7         1d
quotes    9         9         9         6         1d
quotes    9         9         9         7         1d
quotes    9         9         9         8         1d
quotes    9         9         9         9         1d
The output shows how Kubernetes detected that it got short of available pods and compensated that by scheduling new containers for the affected pods.
Now, let’s make it even worse by removing a worker node, simulating that it is taken off line for maintenance work. Let’s mark kube-node-3 as no longer accepting either existing pods or scheduling of new pods:
kubectl drain kube-node-3 --ignore-daemonsets
The command reports back what pods that was evicted from the node:
pod "quotes-77776b5bbc-jlwtb" evicted
pod "quotes-77776b5bbc-7d6gc" evicted
pod "quotes-77776b5bbc-cz8sp" evicted
Kubernetes will however automatically detect this and start new ones on the remaining nodes:
kubectl get pods -o wide
Reports back:
NAME                      READY     STATUS    RESTARTS   AGE       IP            NODE
quotes-77776b5bbc-28r7w   1/1       Running   0          11s       10.192.2.10   kube-node-1
quotes-77776b5bbc-7hxd5   1/1       Running   0          11s       10.192.3.10   kube-node-2
quotes-77776b5bbc-c8mkf   1/1       Running   0          7m        10.192.3.8    kube-node-2
quotes-77776b5bbc-dnpm8   1/1       Running   0          31m       10.192.3.4    kube-node-2
quotes-77776b5bbc-gpk85   1/1       Running   0          7m        10.192.2.8    kube-node-1
quotes-77776b5bbc-grcqn   1/1       Running   0          11s       10.192.2.11   kube-node-1
quotes-77776b5bbc-qr27h   1/1       Running   0          7m        10.192.3.9    kube-node-2
quotes-77776b5bbc-txpcq   1/1       Running   0          7m        10.192.2.9    kube-node-1
quotes-77776b5bbc-wzhzz   1/1       Running   0          7m        10.192.2.7    kube-node-1
Note: The three pods with an age of 11 sec are the new ones.
We can also see that the node is reported to being unavailable for scheduling of pods:
kubectl get node
Reports:
NAME          STATUS                     AGE       VERSION
kube-master   Ready                      1d        v1.8.4
kube-node-1   Ready                      1d        v1.8.4
kube-node-2   Ready                      1d        v1.8.4
kube-node-3   Ready,SchedulingDisabled   1d        v1.8.4
Great!
Let’s wrap up by making the node available again:
kubectl uncordon kube-node-3
The node is now reported to be back on line:
kubectl get node
Results in:
NAME          STATUS    AGE       VERSION
kube-master   Ready     1d        v1.8.4
kube-node-1   Ready     1d        v1.8.4
kube-node-2   Ready     1d        v1.8.4
kube-node-3   Ready     1d        v1.8.4
But none of the existing pods are automatically rescheduled to the node:
kubectl get pods -o wide
Still reports that all pods runs on node 1 and 2:
NAME                      READY     STATUS    RESTARTS   AGE       IP            NODE
quotes-77776b5bbc-28r7w   1/1       Running   0          4m        10.192.2.10   kube-node-1
quotes-77776b5bbc-7hxd5   1/1       Running   0          4m        10.192.3.10   kube-node-2
quotes-77776b5bbc-c8mkf   1/1       Running   0          11m       10.192.3.8    kube-node-2
quotes-77776b5bbc-dnpm8   1/1       Running   0          36m       10.192.3.4    kube-node-2
quotes-77776b5bbc-gpk85   1/1       Running   0          11m       10.192.2.8    kube-node-1
quotes-77776b5bbc-grcqn   1/1       Running   0          4m        10.192.2.11   kube-node-1
quotes-77776b5bbc-qr27h   1/1       Running   0          11m       10.192.3.9    kube-node-2
quotes-77776b5bbc-txpcq   1/1       Running   0          11m       10.192.2.9    kube-node-1
quotes-77776b5bbc-wzhzz   1/1       Running   0          11m       10.192.2.7    kube-node-1
We can, however, manually rebalance our pods with the commands:
kubectl scale --replicas=6 deployment/quotes
kubectl scale --replicas=9 deployment/quotes
Verify:
kubectl get pods -o wide
Reports the expected three pod per node again:
NAME                      READY     STATUS    RESTARTS   AGE       IP            NODE
quotes-77776b5bbc-2q26w   1/1       Running   0          1s        10.192.4.13   kube-node-3
quotes-77776b5bbc-bbhcb   1/1       Running   0          1s        10.192.4.14   kube-node-3
quotes-77776b5bbc-c8mkf   1/1       Running   0          13m       10.192.3.8    kube-node-2
quotes-77776b5bbc-dnpm8   1/1       Running   0          37m       10.192.3.4    kube-node-2
quotes-77776b5bbc-gpk85   1/1       Running   0          13m       10.192.2.8    kube-node-1
quotes-77776b5bbc-qr27h   1/1       Running   0          13m       10.192.3.9    kube-node-2
quotes-77776b5bbc-trrdh   1/1       Running   0          1s        10.192.4.12   kube-node-3
quotes-77776b5bbc-txpcq   1/1       Running   0          13m       10.192.2.9    kube-node-1
quotes-77776b5bbc-wzhzz   1/1       Running   0          13m       10.192.2.7    kube-node-1
That’s it, let’s remove the Kubernetes cluster:
./dind-cluster-v1.8.sh down
If you start up the cluster again with the up command, it will start up much faster than the first time!
If you don’t want to start up the cluster again, at least in any near time, you can also clean up some data created for the cluster:
./dind-cluster-v1.8.sh clean
If you start up the cluster again after a clean command you are back to the very long startup time.
For more blog posts on new features in Docker, see the blog series - Trying out new features in Docker.