Blogg
Här finns tekniska artiklar, presentationer och nyheter om arkitektur och systemutveckling. Håll dig uppdaterad, följ oss på LinkedIn
Här finns tekniska artiklar, presentationer och nyheter om arkitektur och systemutveckling. Håll dig uppdaterad, följ oss på LinkedIn

Tooling for Observability has exploded in the last decade offering a rich portfolio of products and features to choose from. Ironically this has created some other challenges; vendor specific agents that misbehave, vendor lock in, licensing costs, inflexible centralised observability platforms, and platforms that operate outside the scope of their intended use. The result is often a complex and brittle observability infrastructure that requires significant effort to use and maintain.
It is good to remember that the value added by Observability is the ability to grasp the needs of our customers and to quickly react to incidents. Spending time wrestling with Observability infrastructure detracts from this.
In this blog I will look at OpenTelemetry and how adopting this can ease your Observability journey.
This blog is a special collaboration with Robert Mayer of ROMA IT, an architect and developer with a deep interest in Observability. Here we would like to share some of our experiences of implementing OpenTelemetry in the wild. Before jumping into this blog I would strongly recommend you start with Roberts Introduction to the OTEL Collector
As always, this blog comes with a working example that you can find in our Github repository.
OpenTelemetry intends to address some of this complexity by introducing semantics that define the components of Observability, standards for transfering Observability data (aka Signals), and tooling to make the transfer easier.
OpenTelemetry is available in a number of distributions. This blog will use the open source distribution, but you may already have access to a distribution in your infrastructure, for example the RedHat OpenTelemetry Colllector for OpenShift. So how should we leverage this?
Note: each distribution offers slightly differently features, often with different support levels. Read the documentation with care and check back often as the pace of development is quite high!
I am going to revisit the example from my previous blog to illustrate some ways OpenTelemetry can be leveraged. In this scenario weather stations are producing weather readings and publishing events to Kafka. These events are consumed by a reporting system. The following diagram illustrates the components of the system:

One new component is the OpenTelemetry Collector. The purpose of the collector is to receive, process and export telemetry data consisting of metrics, logs and traces. In this blog we will focus on the receivers and processors.
The Collector comes with extensive documentation for Collector configuration. For this exercise I am deploying all components using docker compose and will observe the componets with a single stand alone Collector runnning in a separate container. This is by no means the only Deployment pattern available and I would recommend the sidecar pattern if you are deploying to OpenShift / Kubernetes.
OpenTelemetry is not an observability platform so you will have to provide one of your choice. For this example we are going to use the Grafana OTEL LGTM image which stores data with Prometheus (metrics), Loki (logs) and Tempo (trace), plus a Grafana instance for visualization.
There is a lot more to say about exporters but we will save that for another blog post.
Let’s start with the easiest case. The weather-producer project contains a homegrown Quarkus application. The developers of this application are ready and able to enable observability with OpenTelemetry.
The intention here is to export telemetry data via the OpenTelemetry protocol, otherwise known as OTLP, to the Collector. A deep dive into the OTLP protocol is out of the scope of this blog, but if you are interested I can strongly recommend a quick read of the OTLP design goals.
Adding an OTLP exporter to a Quarkus app is straightforward and a rare joy. As always the Quarkus documentation is top class and the Quarkus OpenTelemetry guide leads straight to the desired result. Configuration was little more than an enablement flag and to point out the OTLP endpoint in the Collector.
On the Collector side I needed to configure an OTLP receiver as follows:
receivers:
  otlp:
    protocols:
      grpc:
        endpoint: 0.0.0.0:4317
How do we know this works before we commit our code? As always Quarkus already has an answer with their Quarkus Dev Grafana OTEL LGTM extension. If you start the application with quarkus dev you can see the observability data from the weather-producer in isolation prior to commit.
Another useful feature for debugging is the OpenTelemetry logging extension that dumps telemetry data to the console log.
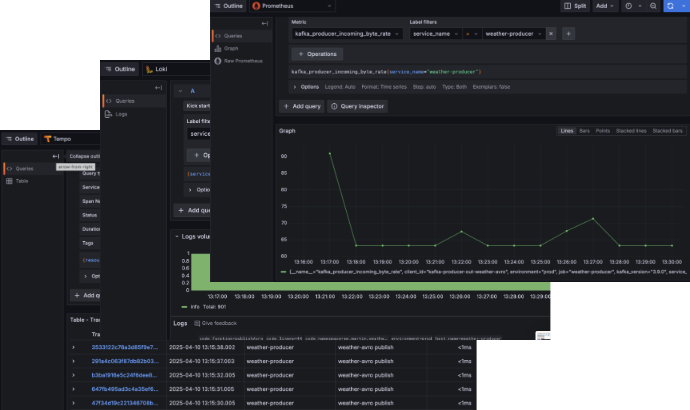
Once the application is started Grafana quickly visualises metrics, logs and trace information:
The weather-consumer represents another home grown application that is unable or unwilling to switch to OTLP. The application is exposing metrics via a Prometheus endpoint for scraping. Fortunately the Collector is a veritable swiss army knife of observability tools.
Configuring the OpenTelemetry Prometheus Receiver to periodically scrape the weather-consumer endpoint is as simple as this:
receivers:
  prometheus:
    config:
      scrape_configs:
        - job_name: 'otel-collector'
          scrape_interval: 5s
          metrics_path: '/q/metrics/prometheus'
          static_configs:
            - targets: [ 'weather-consumer:9002' ]
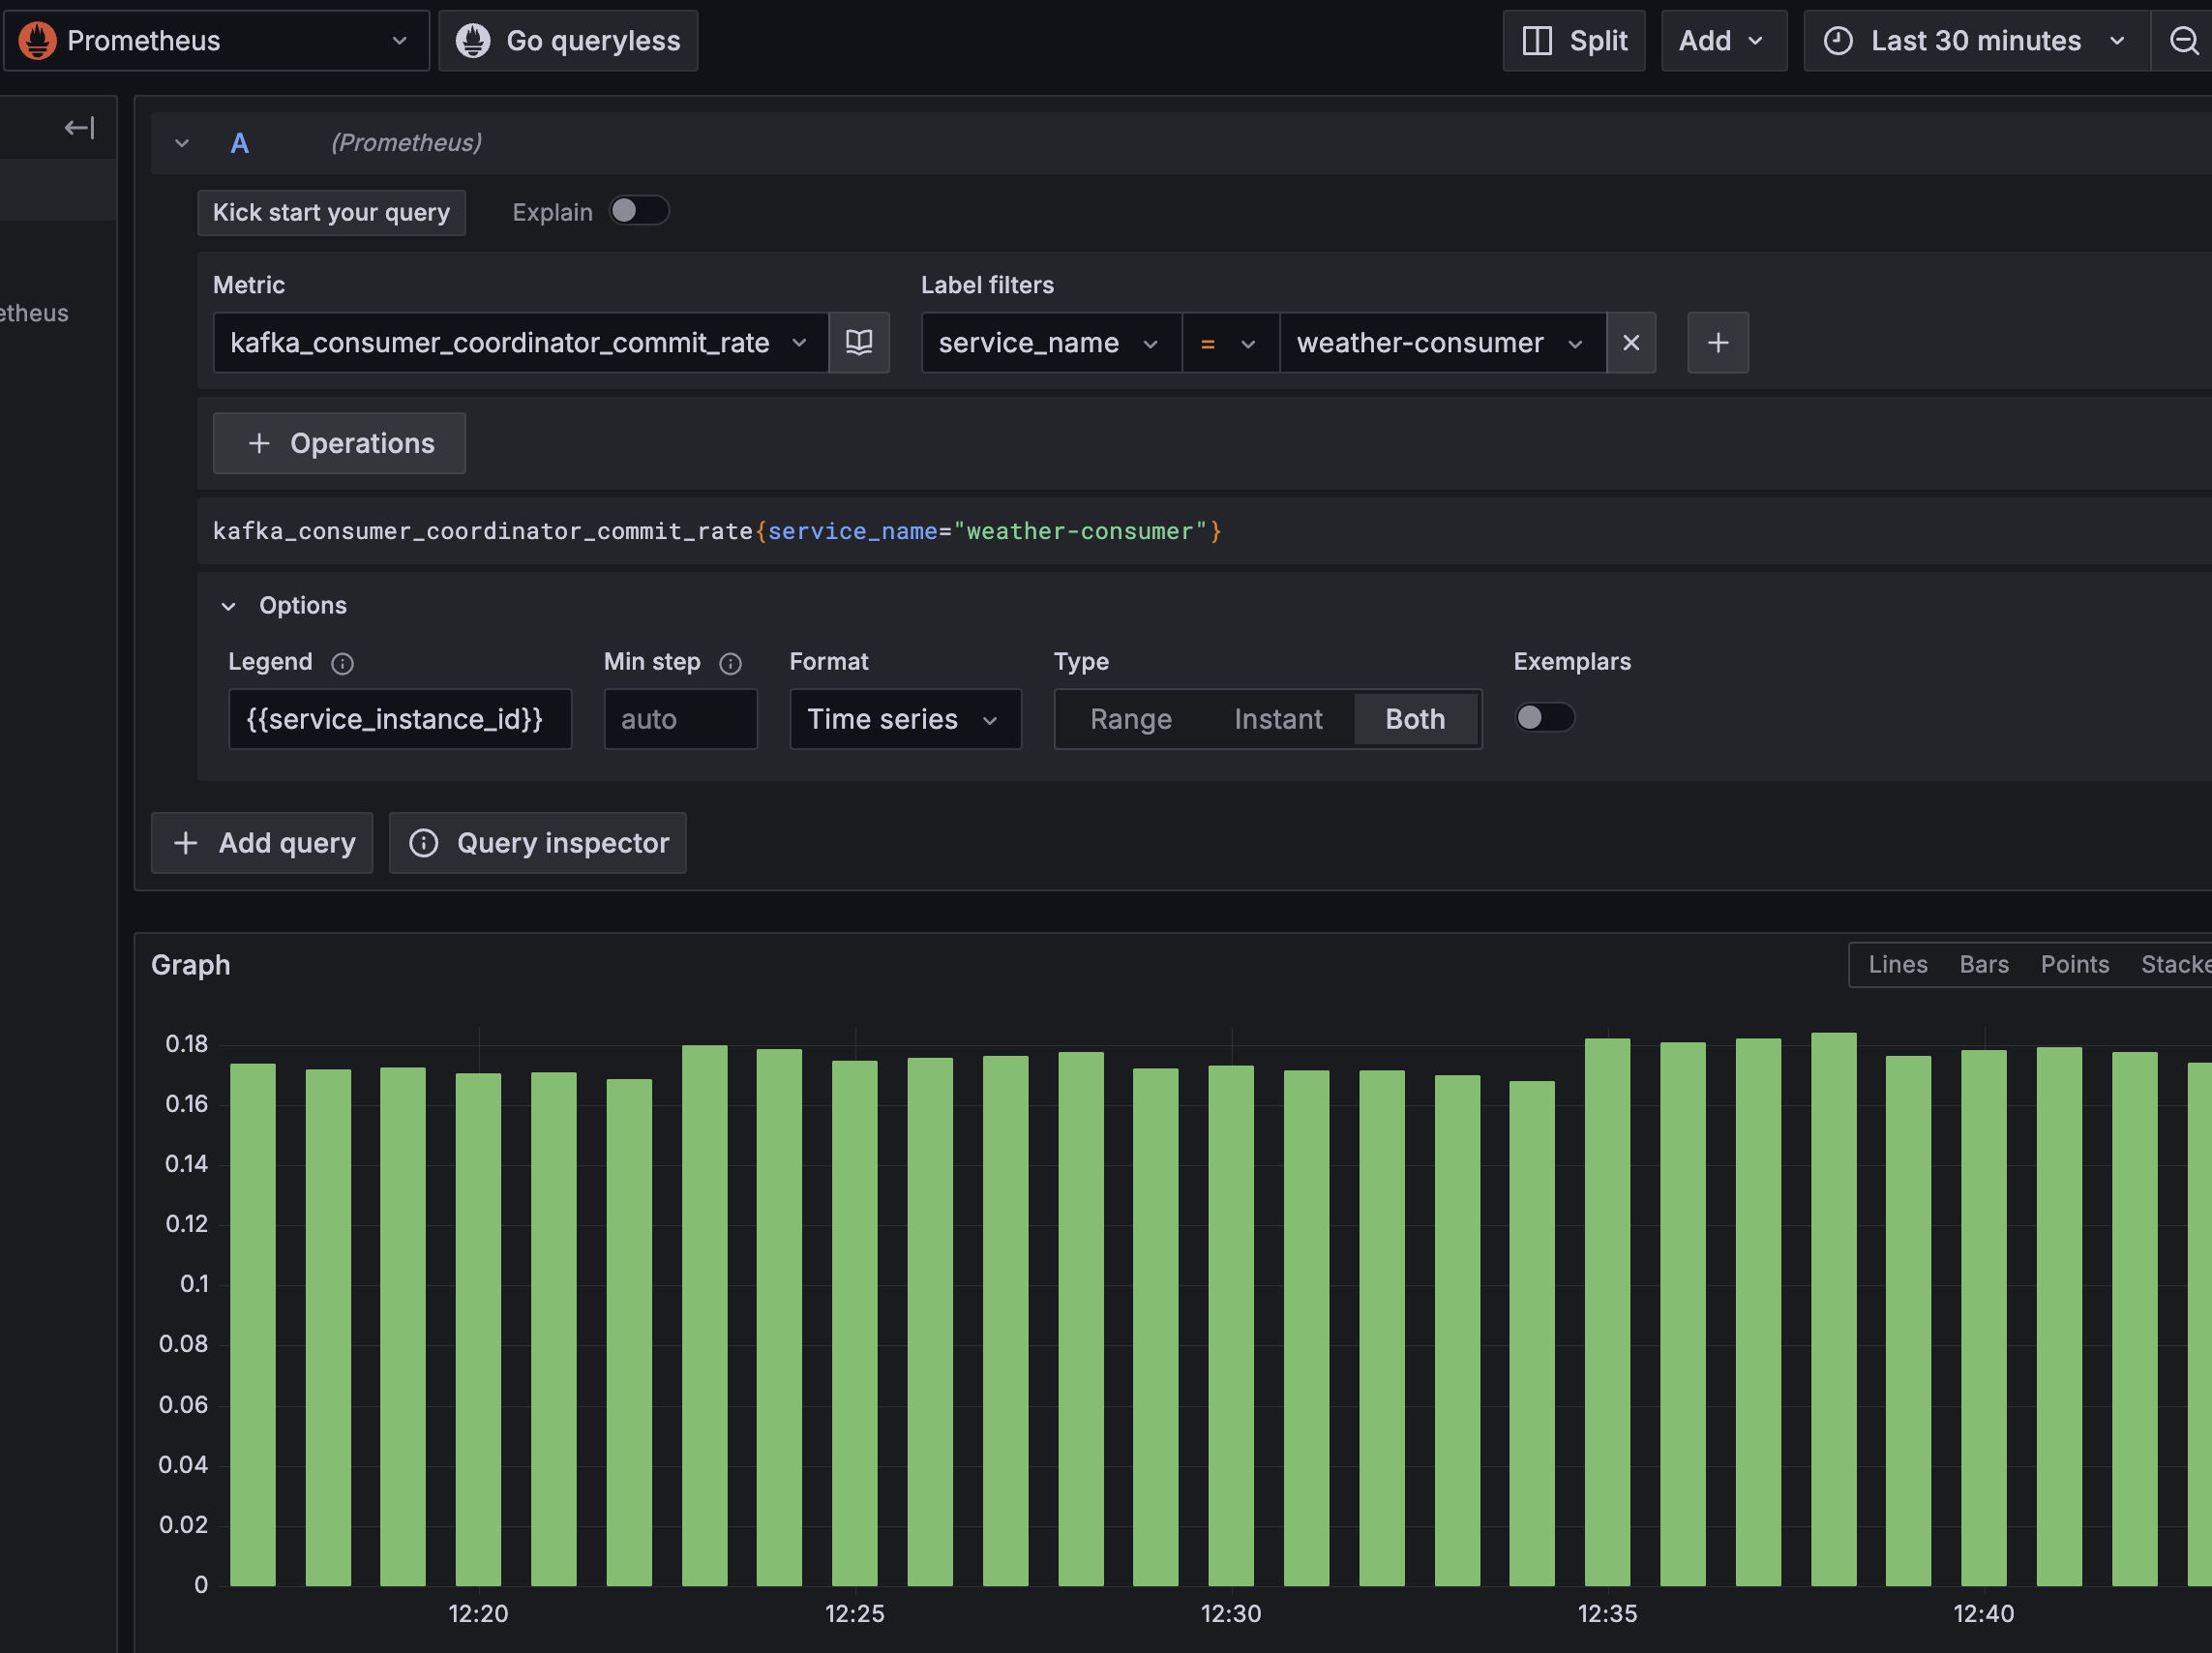
…and once up and running metrics can be visualised in Grafana:
Adding logs and trace requires a little more imagination, and have been omitted from this blog for brevity. The OpenTelemetry FileLogReceiver is a good option for a traditional Java application that uses file based logging (and here a sidecar pattern with shared volumes is a good pattern). Alternatively if your applications can write logs to Kafka then a KafkaReceiver is a great option. As you can see in the receivers section of the Collector you are almost spoilt for choice.
What if you’ve purchased an application and are limited in what you can and want to do? For example, adding OpenTelemetryby extending the vendor supplied image may invalidate your support agreement.
To illustrate this challenge I’ve swapped my Kafka platform to the recently released Apache Kafka 4.0. Let’s assume I don’t want to do anything other than run the image only changing the configuration options that the vendor supports.
As a rule of thumb, if your application already has support for an OTLP integration then use it. Apache Kafka 4.0 does not.
Second choice is to leverage any existing telemetry exporters that the application exposes, for example a Prometheus endpoint. Here we are in luck - Kafka offers remote monitoring with JMX and the Collector offers a JMX Receiver.
A quick look deeper in the Collector toolkit shows there is also a KafkaMetricsReceiver that with a little configuration can scrape metrics:
receivers:
  kafkametrics:
    cluster_alias: kafka-prod
    brokers: [ "broker:29092" ]
    protocol_version: 3.0.0
    scrapers:
      - brokers
      - topics
      - consumers
    collection_interval: 1s
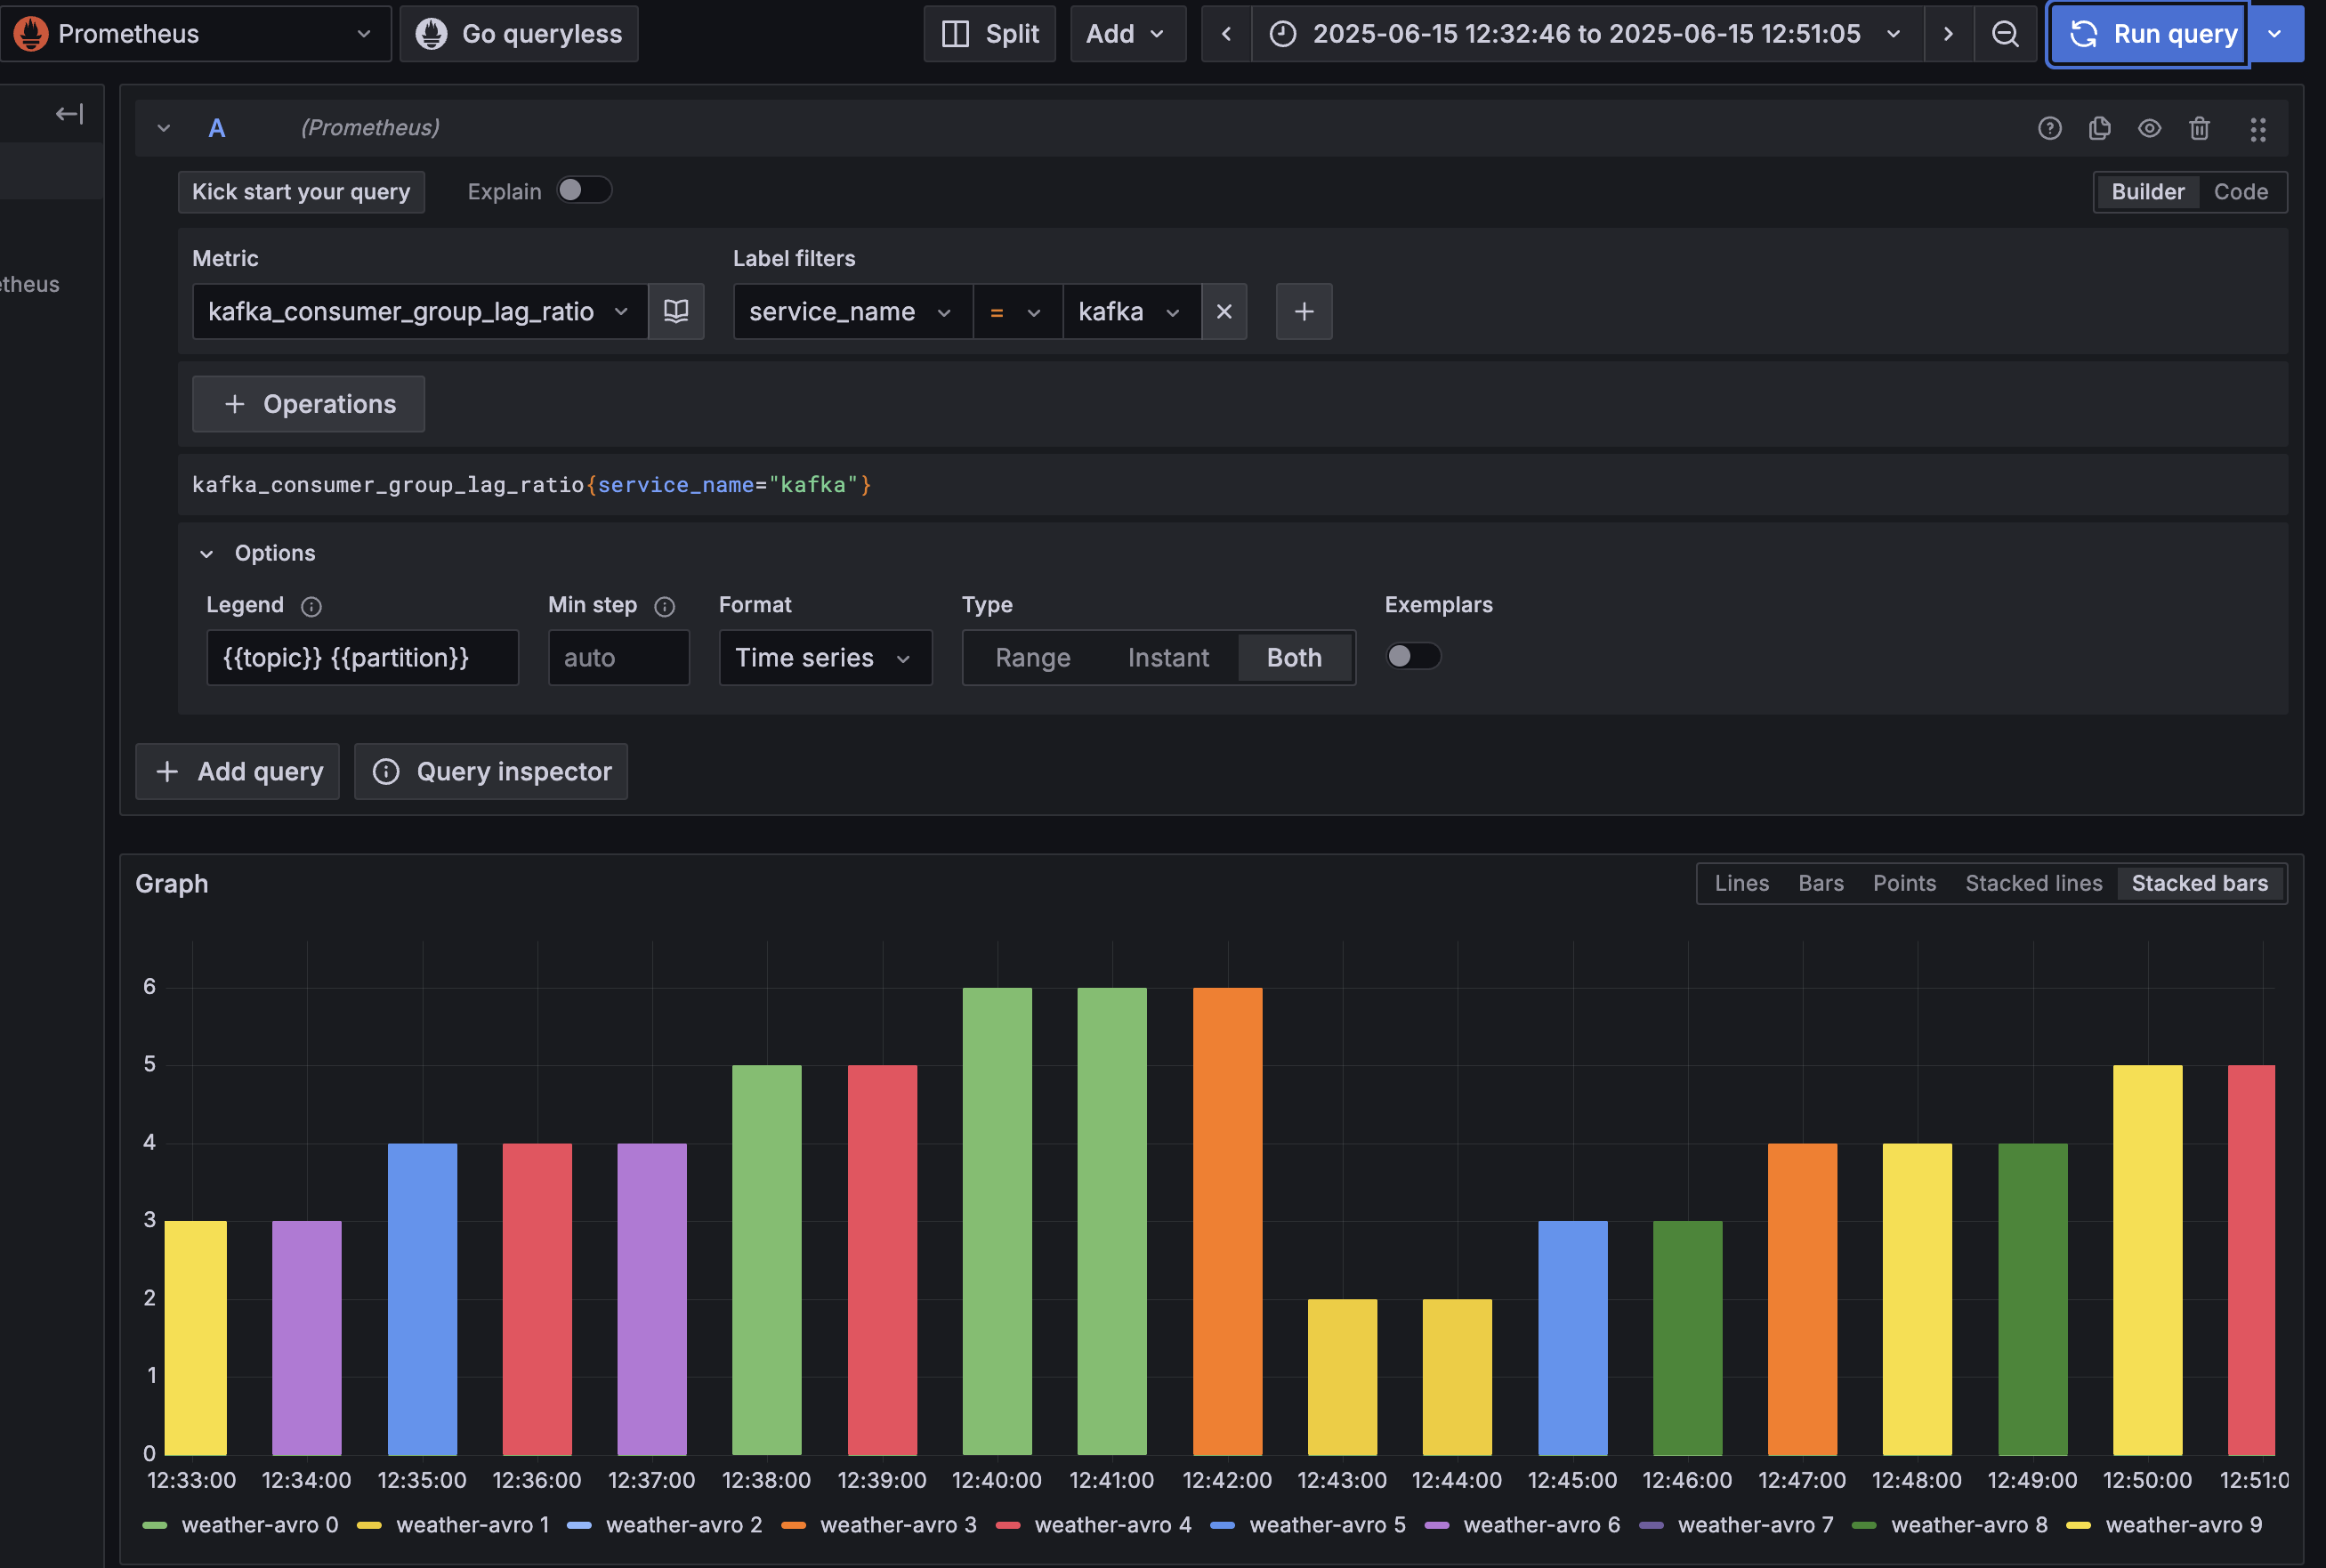
This seems like a sensible choice, and when we connect this to our environment we can see metrics…
If you are less constrained it is worth checking out the Zero Code Instrumentation for OpenTelemetry which provides support for a number of languages. For Apache Kafka the Java Agent is a good fit, but requires some extra effort and comes with some risks. We will likely return to this in a later blog post.
OpenTelemetry also provide a number of SDKs which may be a good fit for your language of choice.
So far we have focussed on how we can leverage the collection of telemetry data using the Collector receivers, now lets look at processors. These processors will help us shape our telemetry data.
Context is essential in understanding what is going on in a distributed system. If you are debugging a problem in a single node you need to be able to isolate the telemetry data for just that node. If you are looking at throughput from the distributed system you may need to collate information from several nodes.
A component that is being observed is known as a Resource. Context is added to telemtry data for a Resource in the form of Attributes. The tooling itself will automatically add attributes (for example see the Quarkus documentation). For the weather-producer some attributes are added in the Docker Compose file:
    environment:
      QUARKUS_PROFILE: prod
      OTEL_RESOURCE_ATTRIBUTES: service.name=weather-producer,service.instance.id=weather-producer-1
You can regard the Attributes added to Resources as a form of contract between your application and your observability platform. It may be the case that you are using the same observability platform to monitor several applications, perhaps mixing observability data for test and production environments. The Resource Semantics Conventions define a number of attributes, and these are the conventions we have settled on in:
kafka represents a broker (and the only obligatory atribute)kafka-1This context is added by the OTEL collector by providing different configurations of the Resource Processor. For example the configuration for the weather-consumer metrics looks like this:
processors:
 resource/all:
    attributes:
      - key: deployment.environment
        value: prod
        action: upsert
      - key: service.namespace
        value: blog-open-telemetry
        action: upsert

  resource/weather-consumer:
    attributes:
      - key: service.name
        value: weather-consumer
        action: upsert
      - key: service.instance.id
        value: weather-consumer-1
        action: upsert
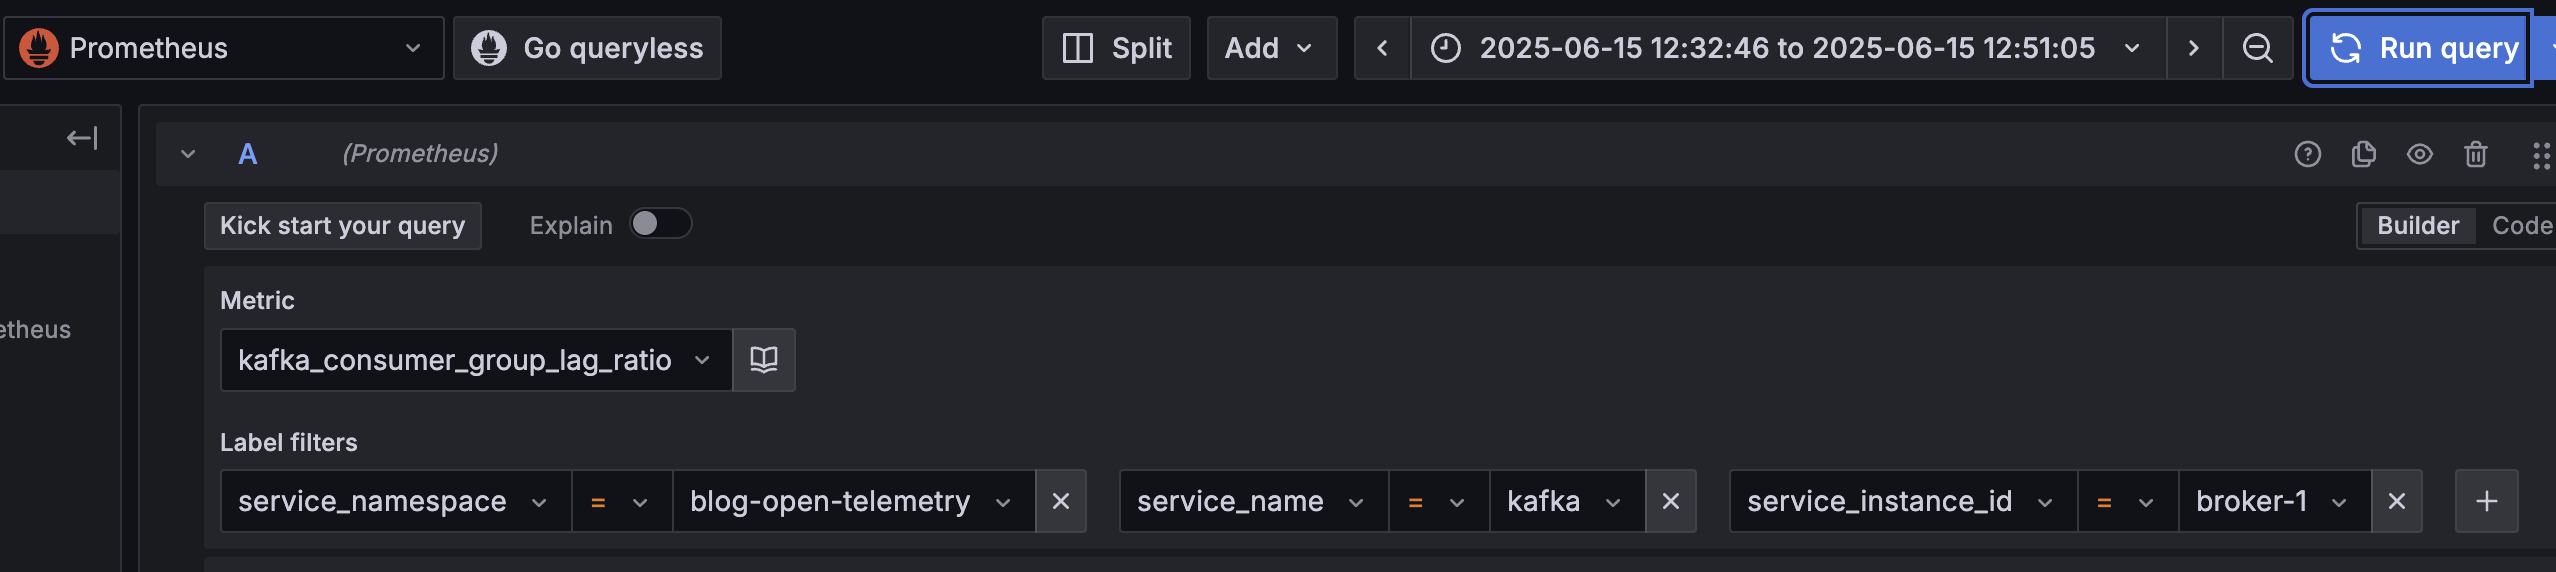
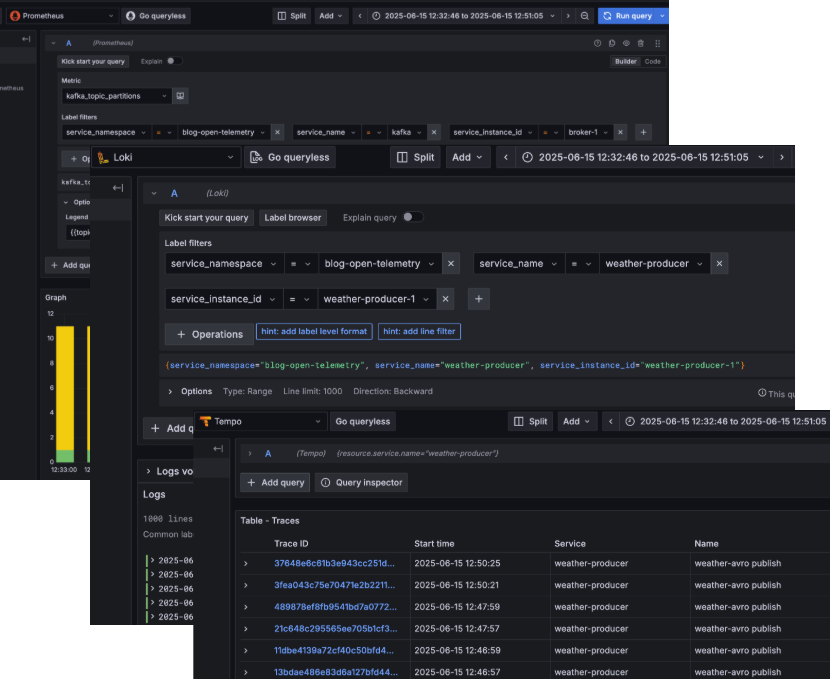
The context is then available as label filters in Grafana (and is available in the new Drilldown feature):
As before we are spoiled for choice when it comes to Processors. The Resource Detection Processor is a great way to pick up context on the operating environment (such a pod names and namespace in a Kubernetes environment).
Filtering your telemetry data is also something you may want or need to do. Our Quarkus applications are spitting out a lot of Http metrics but the integration is Kafka based and these are not relevant. Let’s filter these out using the Filter Processor:
processors:
  filter:
    error_mode: ignore
    metrics:
        metric:
          - 'IsMatch(name, "http.*")'
Other worthy mentions are the Transform Processor which is great for manipulating logs messages, the Resource Detection Processor to pick out attributes from the runtime environment, and the Batch Processor used to batch telemetry data.
Exporters deserve their own blog post but just to illustrate the following configuration was all that was needed:
exporters:
  otlp:
    endpoint: grafana:4317
    tls:
      insecure: true
One exporter that deserves an honorable mention is the Debug Exporter. There will be moments when things are not flowing as you expect and configuring this exporter can give you more insight into what is going on in the Collector:
exporters:
  debug:
    verbosity: normal
So far we have defined receivers, processors and exporters. One more step is needed to get that telemetry data flowing and that is pipeline configuration. The following example for the weather-consumer metrics uses the prometheus recevier, adds context using resource processors and has one exporter to send to the Grafana OTEL LGTM otlp endpoint.
service:
  pipelines:
    metrics/weather-consumer:
      receivers:
        - prometheus
      processors:
        - batch
        - filter
        - resource/all
        - resource/weather-consumer
      exporters:
        - otlp
If we take a look in Grafana we can see that observability data is flowing in nicely!
In this blog we have taken a look at how OpenTelemetry can quickly help developers collect a wealth of observability data. The Collector contains a rich suite of tools to help you collect, shape and publish your telemetry data.
There are plenty of other subjects to investigate that are out of scope of this blog, for example how we to get platform metrics from our Kubernetes environment, or how we could monitor the Collectors and much more.
OpenTelemetry is an area which is maturing quickly so keep an eye on what is supported today and what is supported tomorrow. It is also worth casting an eye over the new CNCF OpenTelemetry Certified Associate certification that was announced recently. Happy observing!