Blogg
Här finns tekniska artiklar, presentationer och nyheter om arkitektur och systemutveckling. Håll dig uppdaterad, följ oss på LinkedIn
Här finns tekniska artiklar, presentationer och nyheter om arkitektur och systemutveckling. Håll dig uppdaterad, följ oss på LinkedIn

In my last blog post we took a dive into OpenTelemetry and how it could be used to gather signals from your applications. One thing was absent - trace! This blog will take a dive into adding trace to the scenario and what you can get out from it.
This blog comes with a working demo that can be found in our Github repo and is now upgraded to Java 25.
What are traces? Let’s take the OpenTelemetry definition:
Traces give us the big picture of what happens when a request is made to an application. Whether your application is a monolith with a single database or a sophisticated mesh of services, traces are essential to understanding the full “path” a request takes in your application.
In the scenario we have a number of microservices collecting weather data (producers) and processing weather data (consumers) that use Kafka as an integration platform. Wouldn’t it be nice to understand how that data traverses the components in the system?
Let’s consider what we could use that “path” information for.
At a microservice level we are interested in tracing a request as it traverses the layers and functions of our application. Traces help us understand how a single request flows across service boundaries, giving visibility into latency, errors, and unexpected dependencies. A common use case is to identify bottlenecks in our processes.
At a higher level, we are interested in understanding how data traverses the nodes of a distributed system. Traces can give us confidence that data is flowing as intended and help uncover where it isn’t — whether due to network latency, message loss, or unexpected routing. Distributed tracing ties together individual spans from multiple services into a single end-to-end view, allowing us to see how a request or event moves across the system. This level of observability can be essential to verify that our system behaves as designed.
Kafka brokers treat messages as opaque payloads - they simply move bytes from producers to consumers without interpreting headers or metadata. There is no trace data captured within the Kafka platform - it just isn’t considered interesting.
In the scenario we only capture trace information from the consumers and producers.
A Span represents a single unit of work within a trace. The SpanContext comprises of data points such as a Trace Id and Span Id. A detailed description of the components can be found in the OpenTelemetry Traces documentation.
In this blog we will look at how Spans can be linked to other spans to provide context within and across the system.
The weather-producer is a Quarkus app that uses a @Scheduled task to push weather information to Kafka. This is the initiator of the trace, and as we already have OpenTelemetry tooling starting a trace is as simple as adding another annotation:
    @Scheduled(every = "1s")
    @WithSpan("scheduler-span")
    void generate() {
We want deeper insight so we will start new child spans when the application generates a weather report and when the application produces the report to Kafka. For the Kafka producer we simply add the same annotation:
    @WithSpan("service-span")
    public Weather fetch(String stationName) {
Easy, huh? How about the service that produces to Kafka?
    var currentContext = Context.current();

    WEATHER_STATION_NAMES.stream().parallel()
        .forEach(stationName -> {
            try (Scope scope = currentContext.makeCurrent()) {
                Weather weather = weatherService.fetch(stationName);
                publishAvro(weather);
            }
        });
Here can we see an example of the challenges that can occur to propagate context between processes. I will talk more on context propagation in a little while but essentially when the Kafka producer starts a new Span we want it to be a child of the original Span, i.e. be part of the same trace. The span context here is not propagated across Java threads so we have to manually propagate the context.
This may look a bit ugly (the generate() method has 7 of 15 lines related to Observability) but the result is a thing of beauty. If I run quarkus dev and inspect the logs I can see:
... traceId=d8e9dcd88c254acdbf28529edef03875, parentId=, spanId=5a545ffa31af1ff1 [WeatherScheduler] Fetching weather schedules
... traceId=d8e9dcd88c254acdbf28529edef03875, parentId=5a545ffa31af1ff1, spanId=414b446254e32ed6 [WeatherService] Sending weather report for SUNDSVALL
... traceId=d8e9dcd88c254acdbf28529edef03875, parentId=5a545ffa31af1ff1, spanId=06f05e7bf460aed7 [WeatherService] Sending weather report for LUND
... traceId=d8e9dcd88c254acdbf28529edef03875, parentId=5a545ffa31af1ff1, spanId=bf57ff1951f530f6,  [WeatherScheduler] Producing message using Avro with id ca8fa4ec-c60b-42dc-a3e5-960825068190
Here we can see that the traceId is consistent across the logs and that the parentId is set from the initial Span. The relationship between Spans is described best in the OpenTelemetry documentation.
The weather-consumer is a similar case. This was originally intended as a legacy application, but for the purpose of this blog it is now enabled with OpenTelemetry features to enable logging and trace - more on that soon.
Let’s start the application and let it get warm.
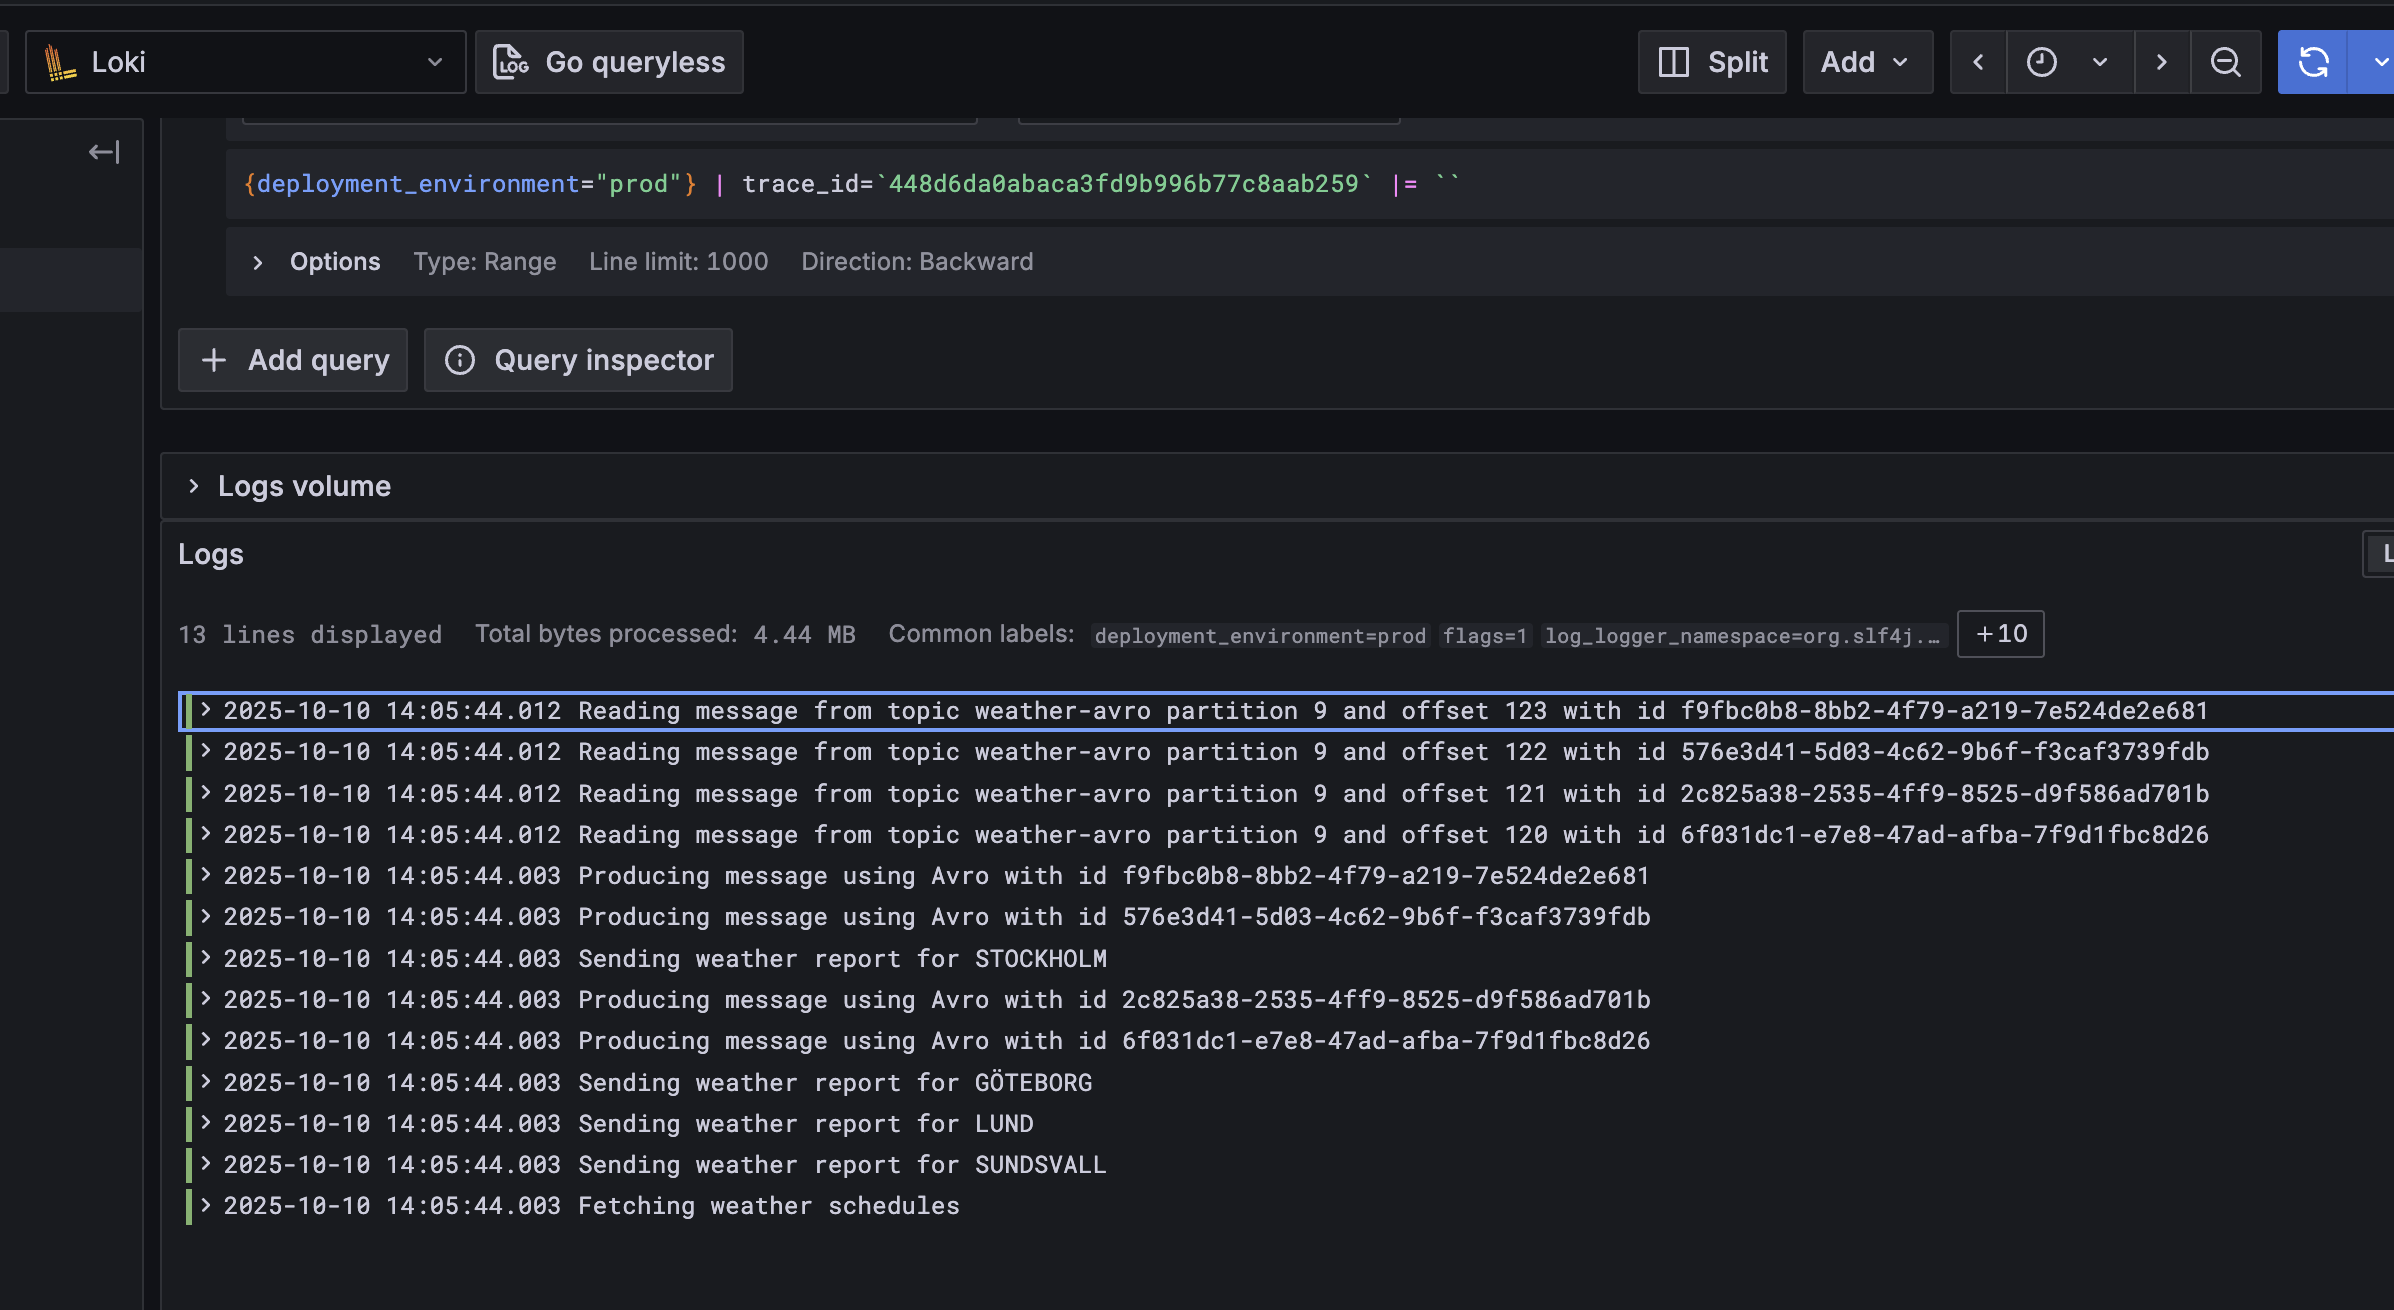
If we look in the Loki logs we can see that searching by traceId gives us logs from all services, and that traceId is automagically mapped to a label by OTEL.
If we take a look in Tempo we can see more details:
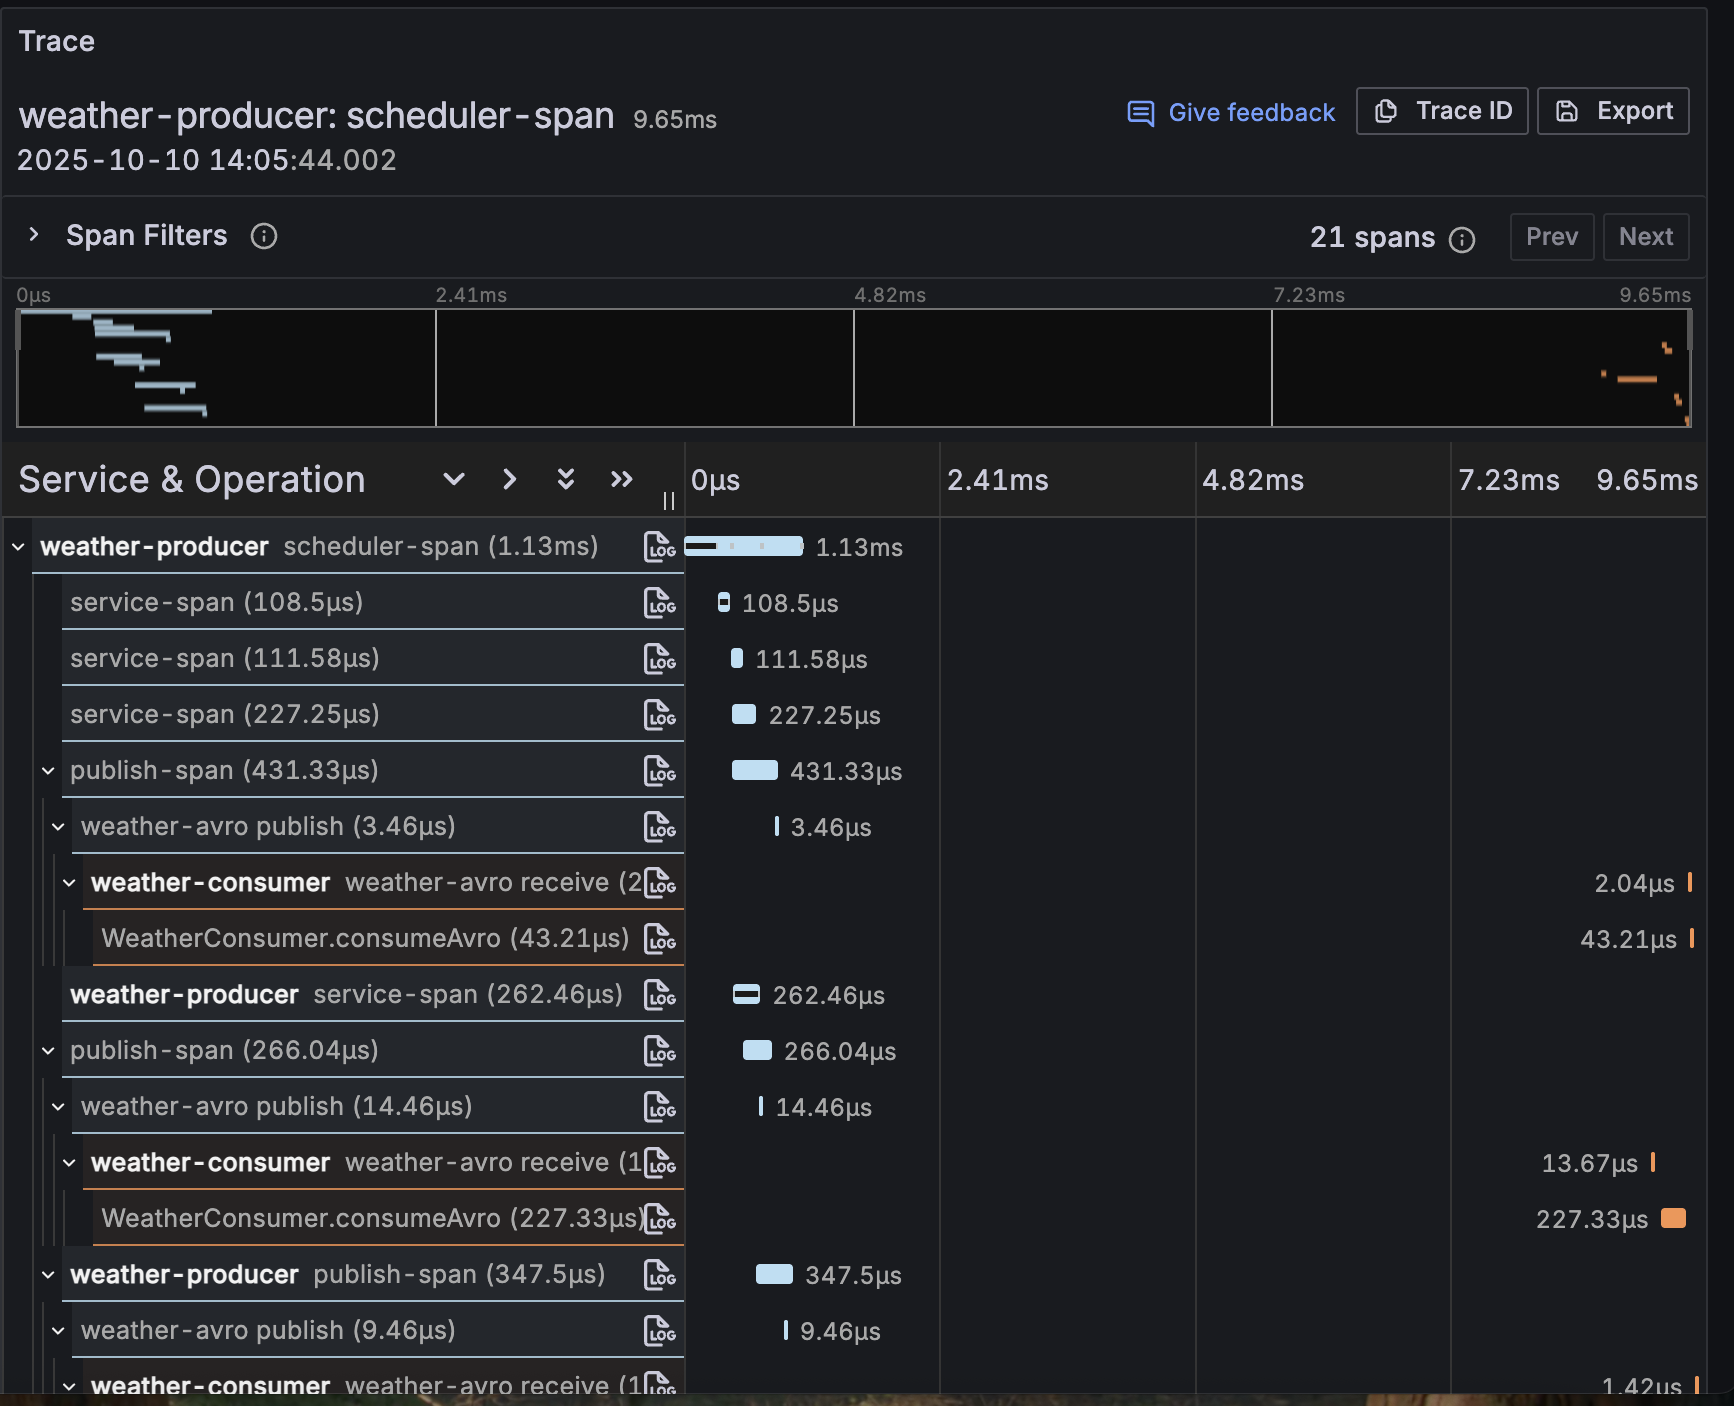
And now we have trace data we can explore!
Propagation is the process of moving the Span Context between units of work; in this example between Java threads or via a Kafka topic. If we take a deeper look at the records published to the Kafka topic we can see that every record contains a header, a key-value pair that looks like this:
## traceparent: {version}-{trace-id}-{span-id}-{trace-flags}
   traceparent: 00-b8ffdeb47a1c5ffd36837250e8f532fc-62b0b3eb2f165f21-01
The format of this data is covered by a standard - the W3C Trace Context standard - which is the default in OpenTelemetry.
Span Context propagation is performed via Kafka Headers which, despite being intuitive, is a praxis and not a standard. Context propagation works here as we have two Quarkus applications enabled with OpenTelemetry - both sides know where to find any Span Context and what to do with it.
Not all applications follow such a praxis (KSqlDb for example) and not all applications have a praxis for storing SpanContext (e.g. databases). This can lead to gaps in the trace information. This doesn’t makes trace useless, just adds to the challenge of providing an overview of data flowing through an entire system or company.
Trace information is not a full or perfectly consistent record of all transactional events. There will almost always be gaps, and these gaps arise from limitations in instrumentation and tooling, not from issues in your application itself. Tracing provides representative visibility, not a complete audit trail. I’ll discuss sampling in a later post, but in most cases, you don’t want, or need, to trace everything. The goal is insight, not completeness.
In this post, we’ve added tracing to our Observability signals, peeked at the code that makes it work, and explored how trace information is propagated through our system. Combining trace information with metrics and logs will give you powerful tools to identify and address bottlenecks in your systems. Happy tracing!