Blogg
Här finns tekniska artiklar, presentationer och nyheter om arkitektur och systemutveckling. Håll dig uppdaterad, följ oss på LinkedIn
Här finns tekniska artiklar, presentationer och nyheter om arkitektur och systemutveckling. Håll dig uppdaterad, följ oss på LinkedIn

We have a new fish in the pool! PacketBeat has joined the elastic company as an open source data shipper and analyzer of network packets, integrated with the ELK stack.

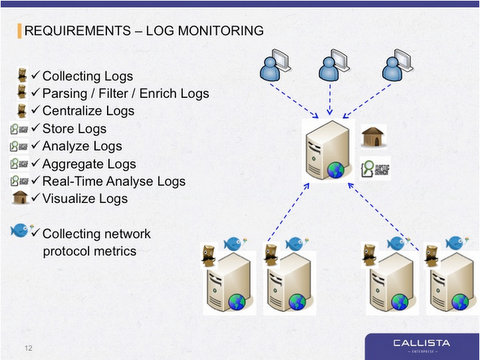
In CADEC 2015 we had a talk on addressing the problem with IT organizations that don’t have enough insight in whats happening in their system landscape. Typical reasons for these problems are technical challenges when it comes to distributed applications, restricted access to environments and correlating events.
We introduced monitoring logs in real time using the ELK stack (Elasticsearch, Logstash and Kibana) as an open source alternative for collecting, indexing, searching and analyzing log data.
Just recently the elastic company introduced the Beats platform, data shippers for elasticsearch, starting with PacketBeat.
PacketBeat is a lighweight network analyzer, a shipper for collecting network metrics. It enables the possibility to sniff for network packet data to be able to monitor performance, find problems and analyze trends in the different network protocols used. Similar functionality can be found in tools like Wireshark and Tcpdump.
Some of the capabilities is to
PacketBeat comes with
Other Beats implementations are discussed in the active community, for example FileBeat (replaces existing logstash-forwarder) and other upcoming {Future}Beats.
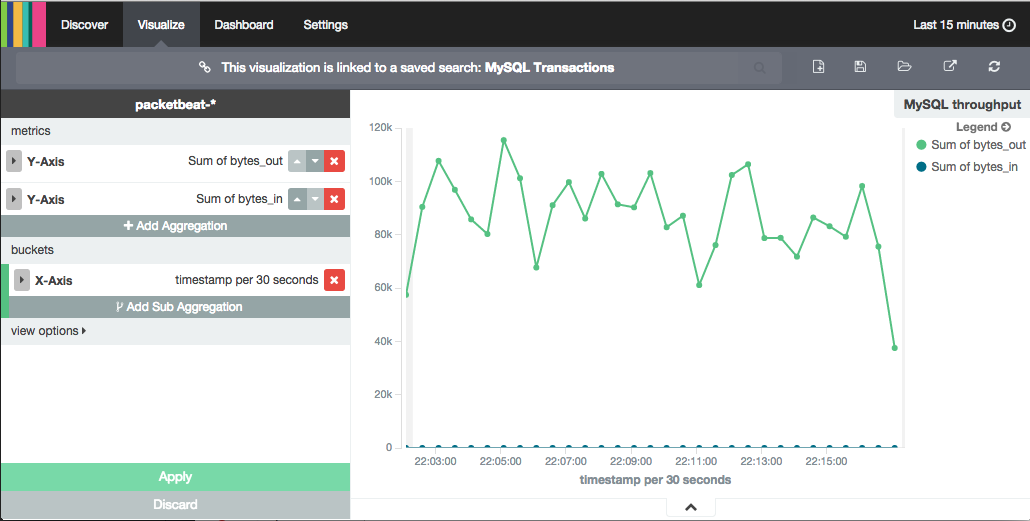
PacketBeat enables monitoring of the MySQL protocol, used between MySQL clients and MySQL servers, to get information like:
This enables us to monitor and identify:
In Kibana 4 the throughput can be visulaized like this:
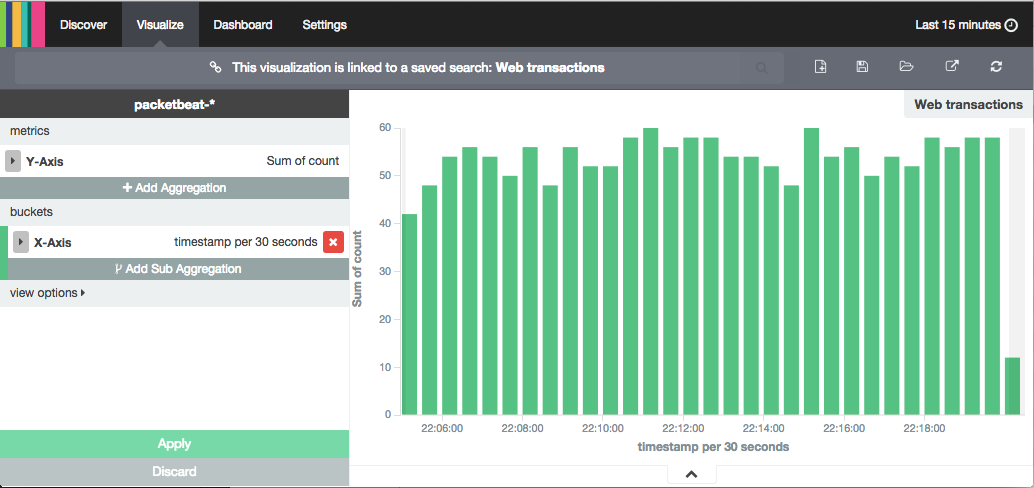
PacketBeat enables monitoring of the HTTP protocol to get information like:
This enables us to monitor and identify:
In Kibana 4 the number of web transactions can be visulized like this:
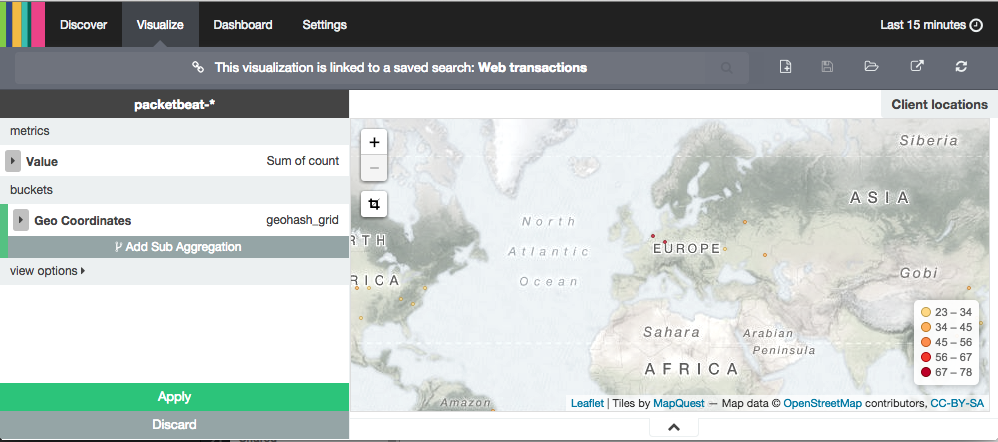
Or, why not visualize the number of transactions based on clients ip address and geographical location:
We have been introduced to PacketBeat, a tool integrated in the ELK stack to collect various network metrics. In a distributed and complex environment this can help IT organizations to do analytics and identify trends based on events occurring in the network layers. Together with Kibana we can visualize the network metrics and events to get a good overview on what’s happening in the system landscape. When writing this blog post PacketBeat was still in 1.0.0-Beta1.