Blogg
Här finns tekniska artiklar, presentationer och nyheter om arkitektur och systemutveckling. Håll dig uppdaterad, följ oss på LinkedIn
Här finns tekniska artiklar, presentationer och nyheter om arkitektur och systemutveckling. Håll dig uppdaterad, följ oss på LinkedIn

In this part of the Go microservices blog series, we’ll explore the concept of distributed tracing and how to add this to our Go microservices.
The finished source can be cloned from github:
> git clone https://github.com/callistaenterprise/goblog.git
> git checkout P12
Note: Most of the Go source code for the blog series was rewritten in July 2019 to better reflect contemporary idiomatic Go coding guidelines and design patterns. However, the corresponding git branch for each part of the series remains unchanged in order to stay aligned with the content of each installment. For the latest and greatest code, look at the master branch in github.
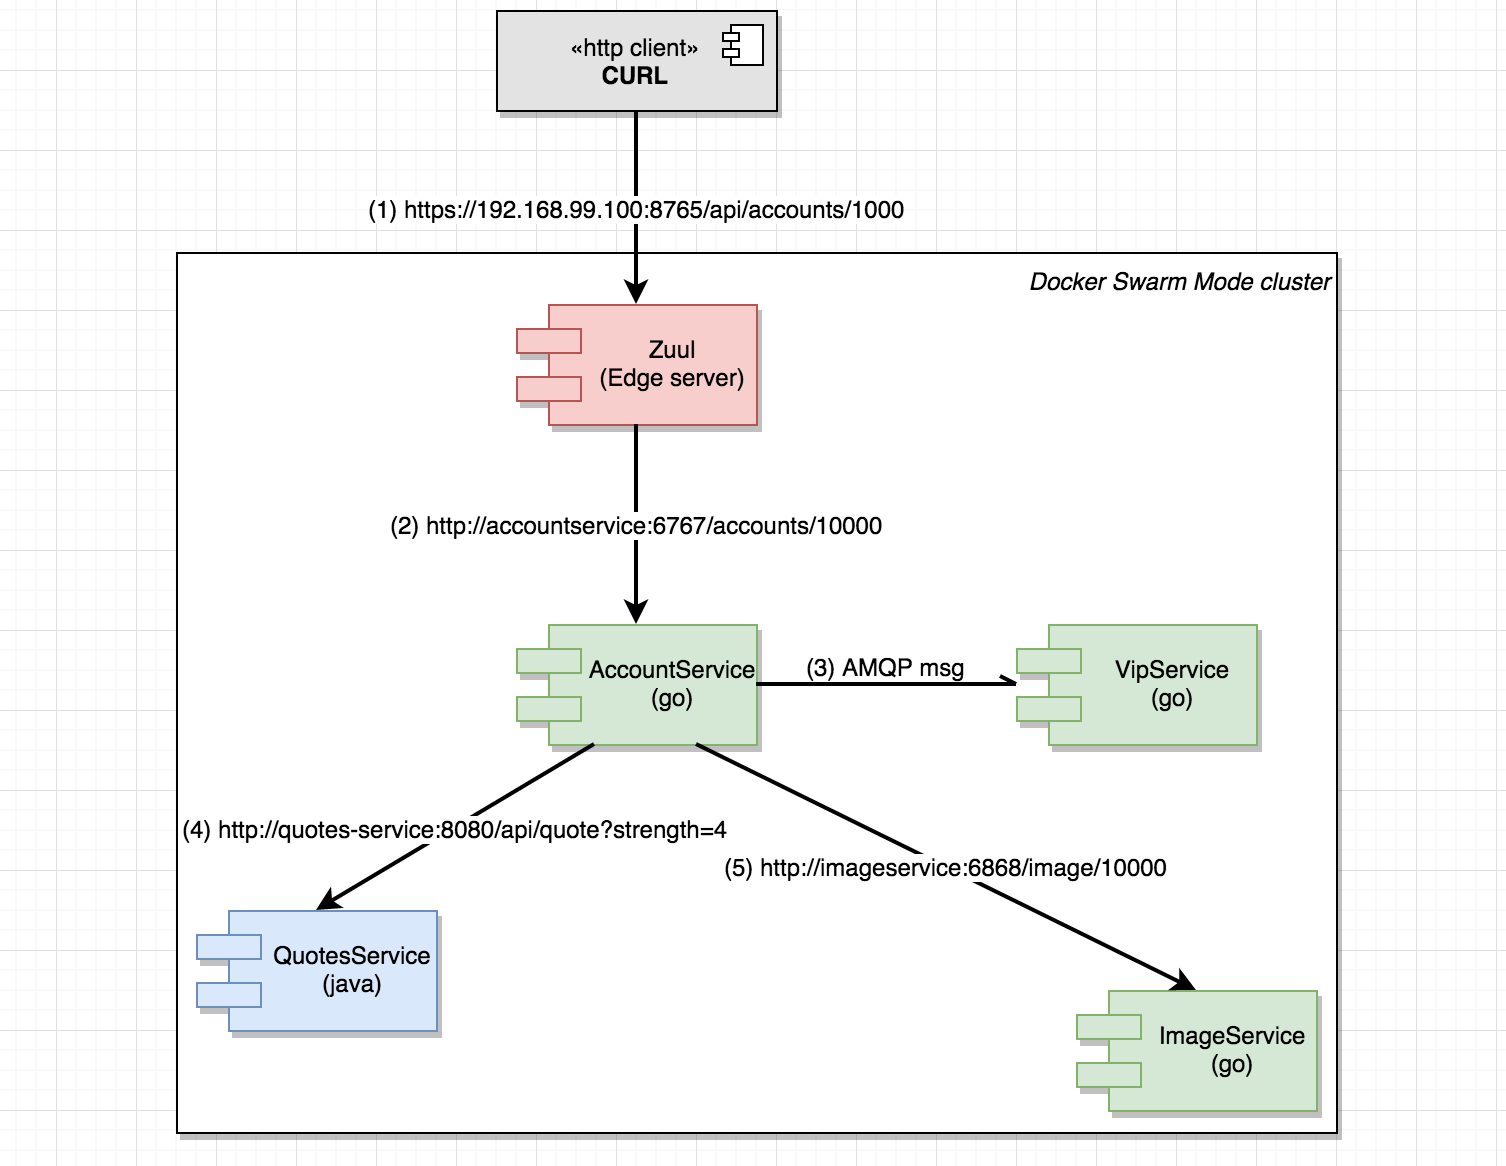
State of the microservices landscape when we’re finished with this part of the blog series:
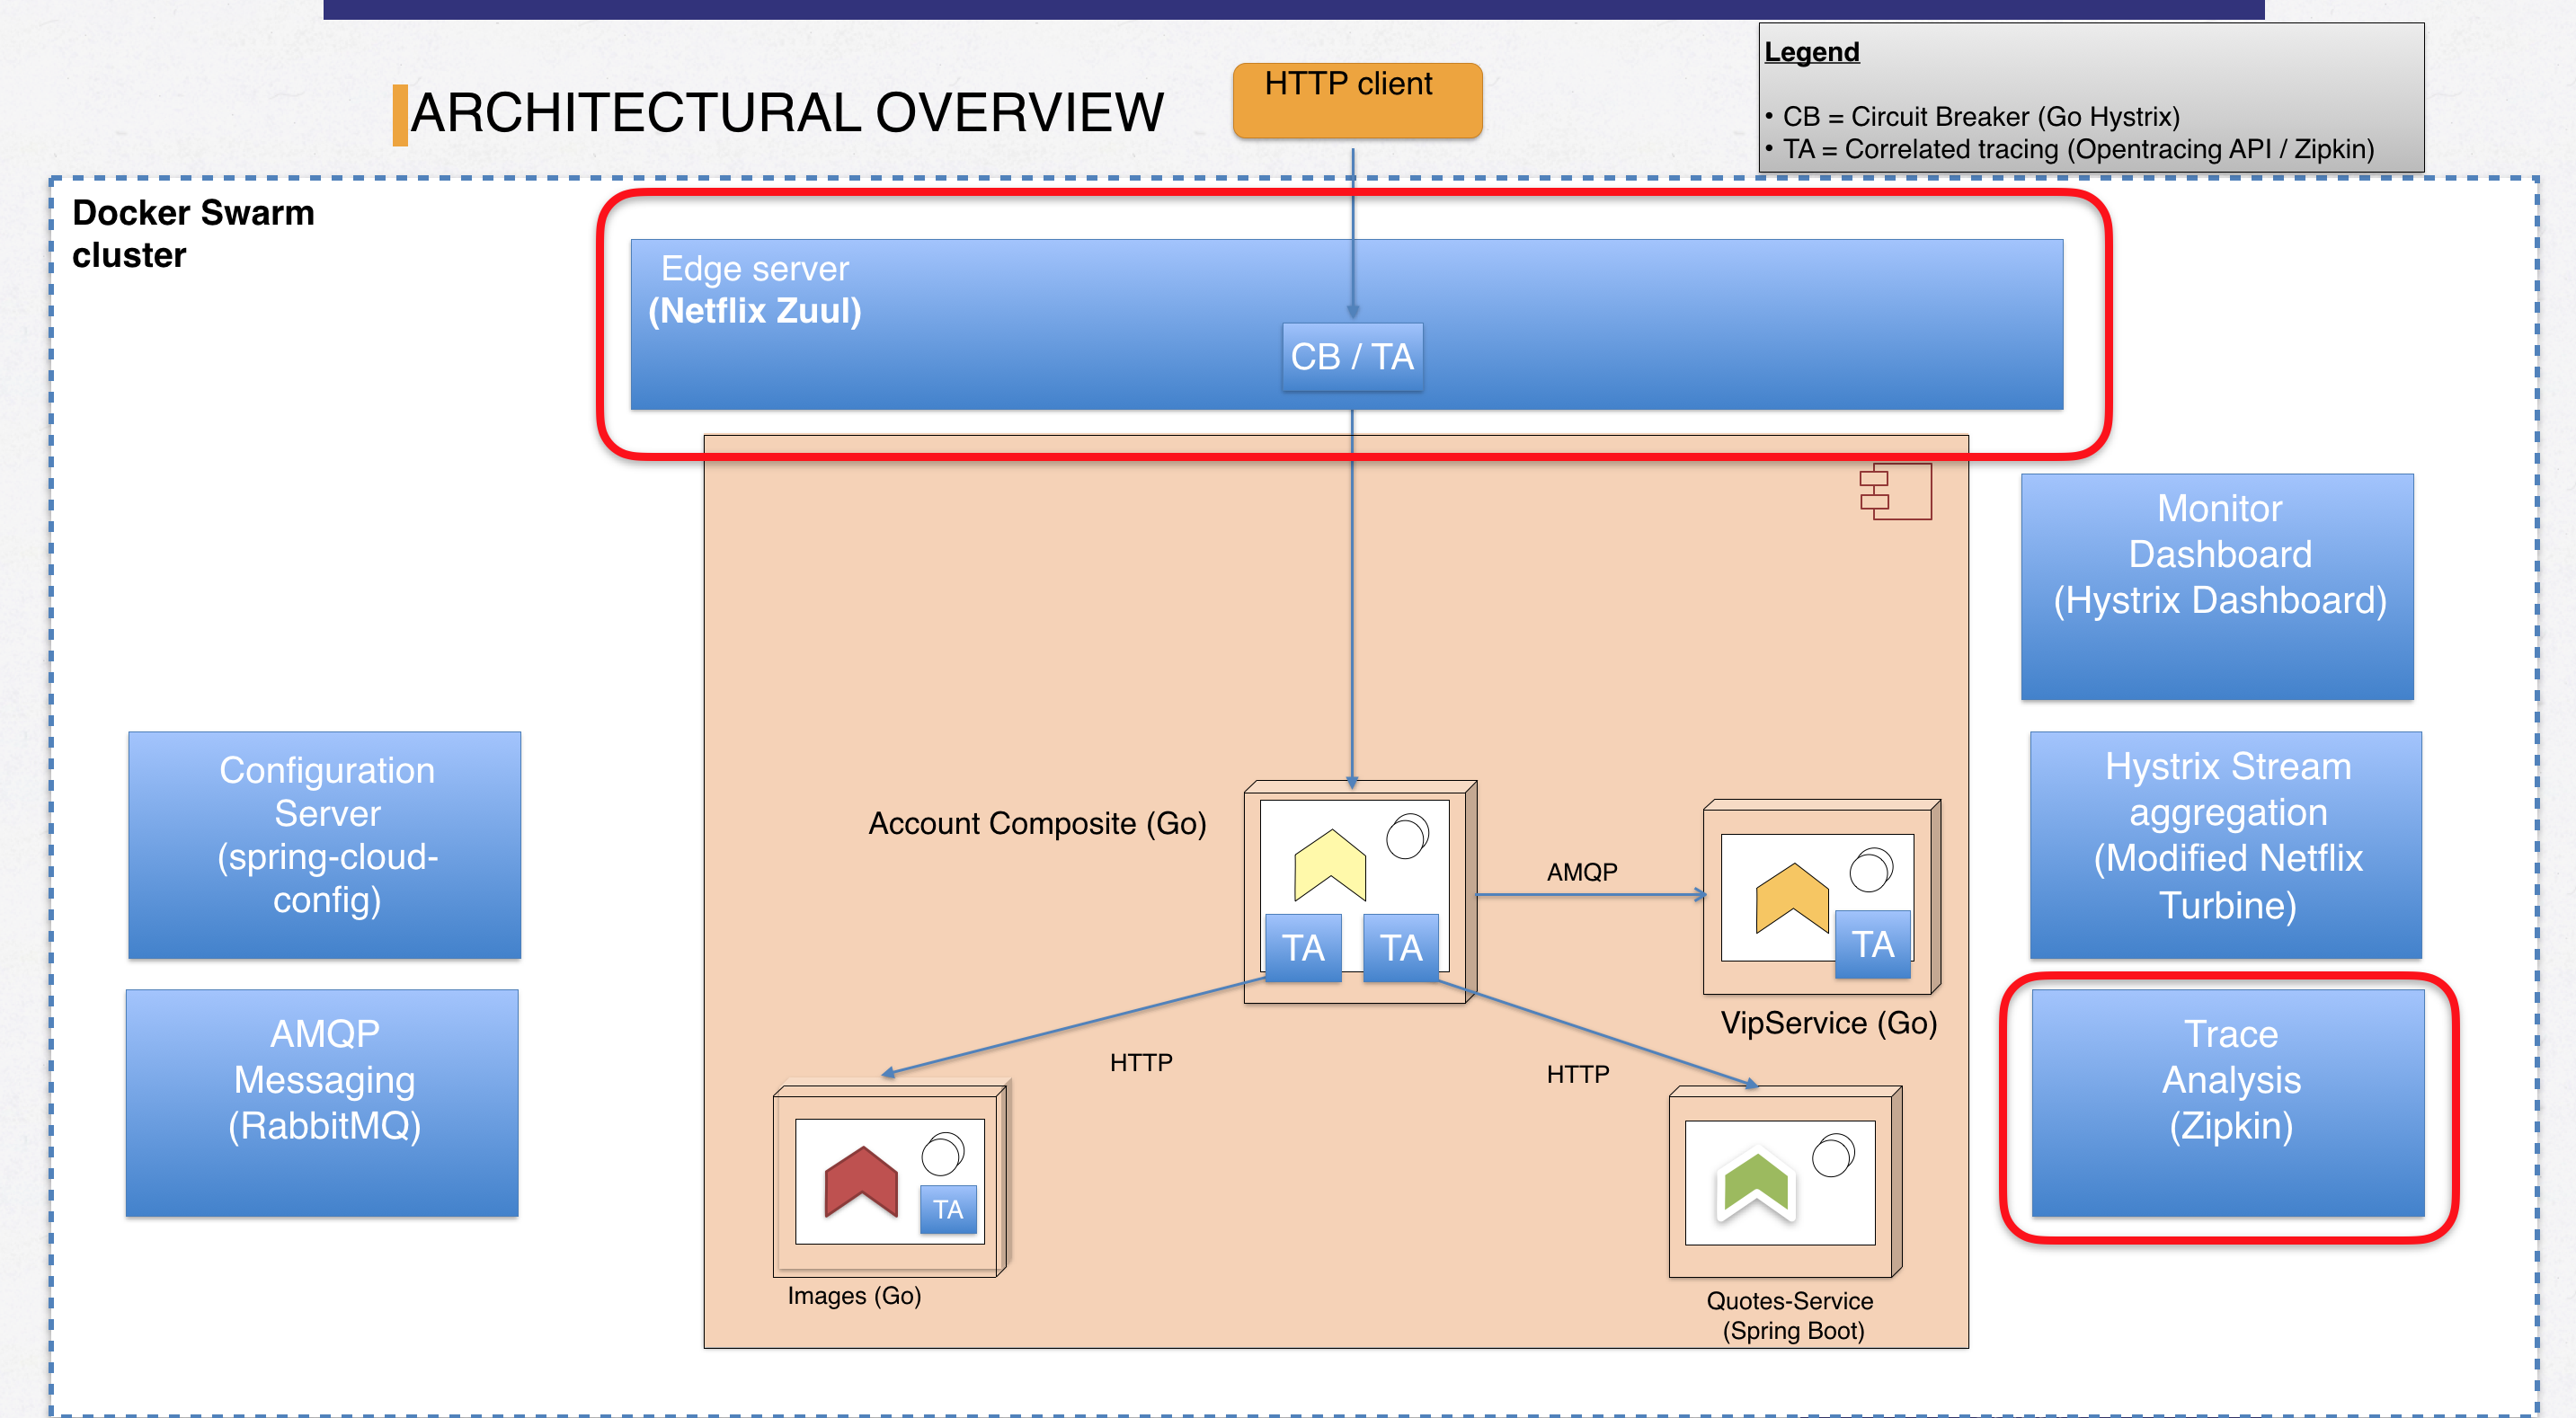 Figure 1: Landscape overview for part 12
Marked with red boxes, we see our two new supporting components - the Zuul EDGE server and Zipkin. Also, we see small boxes with “TA” indicating services where we’ve added distributed tracing.
Keeping track of the life of a request passing through a system (and back) isn’t exactly new. We’ve been adding request ID’s, thread identifiers and user id’s to log statements for ages. However, during the transition from monolithic applications to fine-grained microservices, the complexity increases when requests are passed between microservices, to storage backends, with messages spawning new requests - all belonging to the one and same business transaction. How do we identify performance bottlenecks when a requests is served by a large number of services, possibly in part relying on asynchronous operations completing?
While logs are very useful for this purpose, the concept of distributed tracing has now emerged as an important part of a maintainable and production-ready microservices operations model. For a more in-depth explantion of the rationale and basics of distributed tracing, I suggest reading my co-worker Magnus blog post about Spring Cloud Sleuth and distributed tracing with Zipkin.
Zipkin is an application for visualizing traces between and within services, their supporting components and even messaging. Zipkin originates from Twitter and is currently an open source project on GitHub. Zipkin provides a user-friendly GUI while the backend takes care of collecting tracing data and aggregating those into something we humans can make sense of.
I’m using an external pre-baked container image for Zipkin that exposes port 9411 for the admin GUI. Of course, you can build zipkin from source, configure different storage backends etc.
A docker service create can look like this:
> docker service create --constraint node.role==manager --replicas 1 \
-p 9411:9411 --name zipkin --network my_network \
--update-delay 10s --with-registry-auth  \
--update-parallelism 1 openzipkin/zipkin
The visualization of a distributed trace can look like this (borrowed from my colleagues blog post):
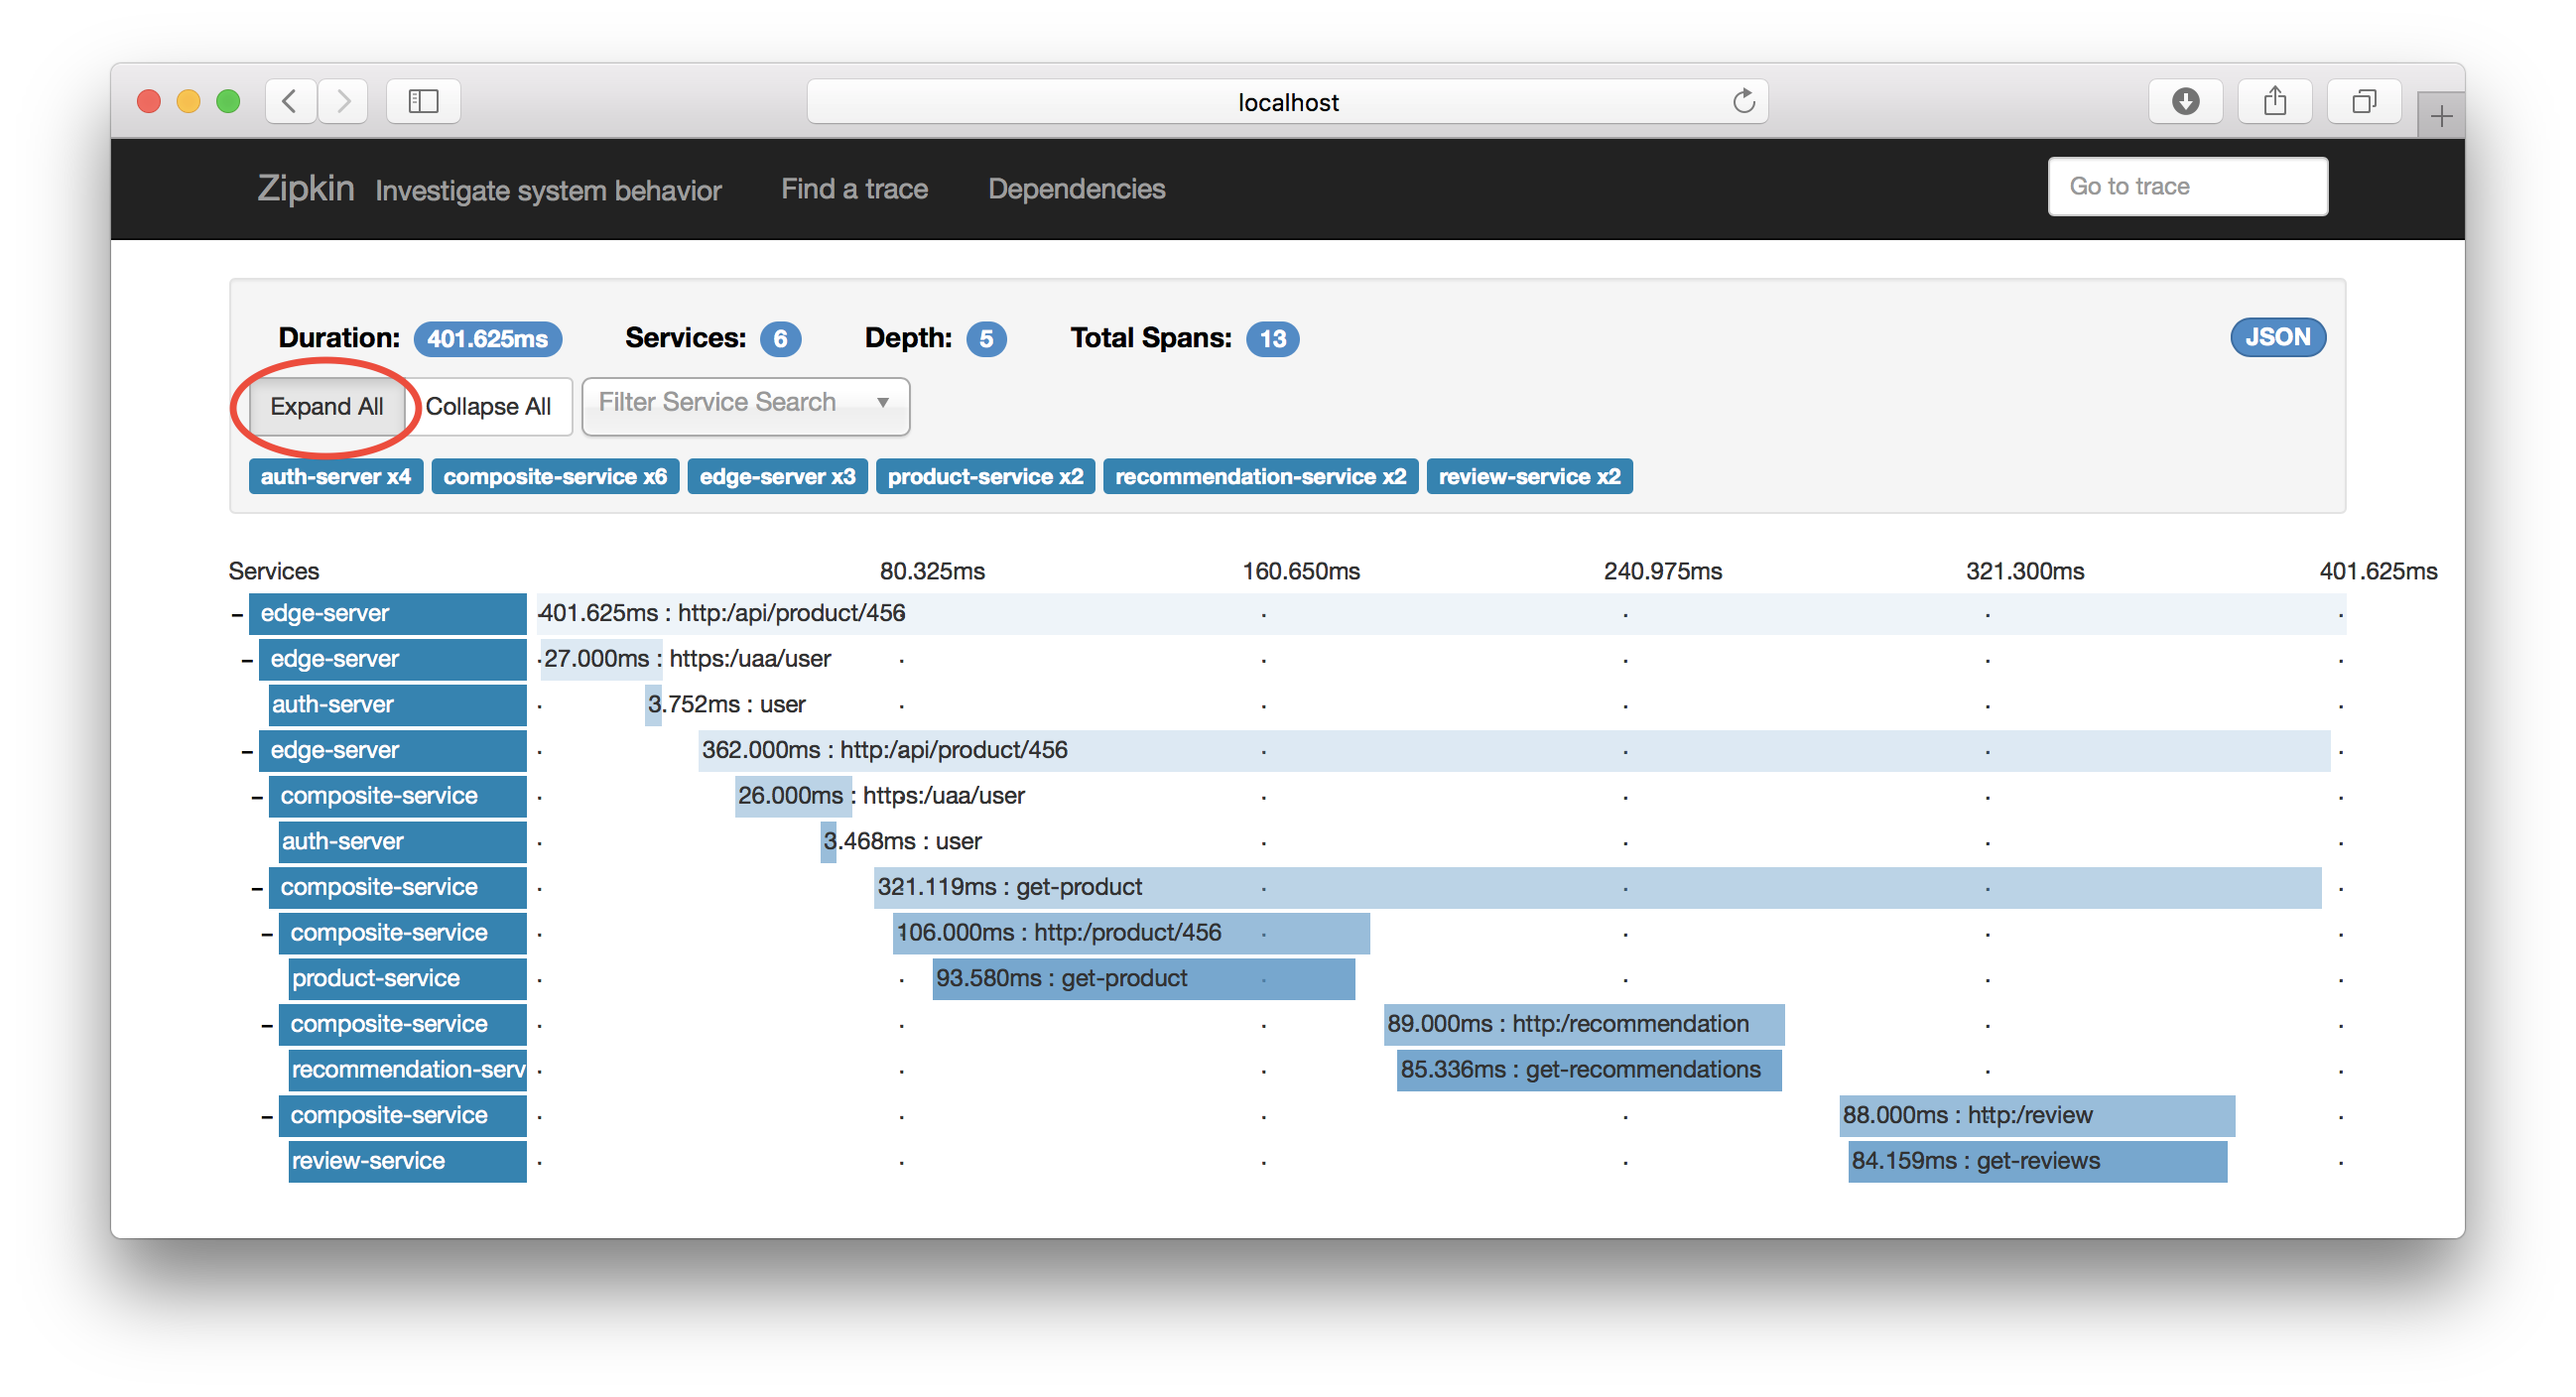
We’ll dig a little bit deeper into the possibilities of Zipkin when we’ve gotten our own tracing up and running.
In order to showcase how we can trace a request from start to finish, we’ll introduce an Edge server capable of adding zipkin-compatible tracing information to HTTP requests out of the box. Netflix Zuul is the default Edge server of Spring Cloud / Netflix OSS.
If you’re wondering what the difference is between an Edge Server, a reverse-proxy and a load-balancer such as Nginx or HAProxy you’re probably in good company. From my point of view, an Edge Server such as Netflix Zuul can act both as reverse proxy, load-balancer and to some extent a security gateway with capabilities to support your applications with - for example - routing requests to the appropriate internal service, adding correlation id’s to inbound requests or relaying certain HTTP headers such as OAuth tokens.
The “edge” in the name stems from the fact that these servers usually resides where your internal network connects to the public internet or a DMZ net - or even between different applications within your own enterprise, acting as the single way traffic may enter the logical internal network of your application.
I’ve prepared a container image pre-configured for our sample landscape with Spring Sleuth / Zipkin enabled as well as a simple routing rule that will provide a https endpoint at /api/accounts/{accountId} that will forward requests to our good ol’ underlying “accountservice” at port 6767.
Just a glimpse of some of the Zuul configuration:
# Disable Eureka service discovery, we're on Docker Swarm mode.
eureka:
  client:
    enabled: false

# Enable zipkin support, sample all requests
spring:
  zipkin:
    baseUrl: http://zipkin:9411
  sleuth:
    sampler:
      percentage: 1.0
sample:
  zipkin:
    enabled: true

# Zuul routing rules, will create /api/accounts/ mapping to  http://accountservice:6767/accounts
zuul:
  ignoredServices: "*"
  prefix: /api
  routes:
    accountservice:
      path: /accounts/**
      url:  http://accountservice:6767/accounts
You can deploy a pre-baked Zuul image for this blog series using the following docker service create:
 docker service create --replicas 1 --name edge-server -p 8765:8765 \
 --network my_network --update-delay 10s --with-registry-auth \
 --update-parallelism 1 eriklupander/edge-server
All of this sounds great - but how do we actually add this cool tracing stuff to our Go-based microservices and how will Zipkin get hold of our traces?
Conveniently enough, there’s a ready to use tracing library for us Go-nuts we can use, named opentracing-go based on the opentracing standard - which is very compatible with Spring Cloud Sleuth used by Zuul and other Spring Cloud-based support services - that we’re already using in this blog series.
In all honesty - Go isn’t the ideal language to add this kind of stuff since there exists no (usable) notion of thread-local storage in Go. Also, the mechanisms offered by interceptors and/or AOP-based programming which is quite suitable for transparently adding functionality such as distributed tracing to a call-stack, isn’t natively available in Go.
However - with some careful use of the go middleware pattern and the go contexts introduced in Go 1.7 we can add tracing to our Go microservices in a somewhat developer-friendly. I must admit I frown a bit upon the context pattern where the idiomatic use is to always pass context.Context as the first parameter of each func in the call stack. Google themselves says the following in the official docs:
"At Google, we require that Go programmers pass a Context parameter as the first argument to every function on the call path between incoming and outgoing requests."
This is a somewhat controversial thing within the Go community. I know thread-locals are considered evil too, though very useful at times to keep track of request-scoped information such as security tokens, user principals and of course logging/tracing IDs.
Oh well - enough of this “I dislike it but I use it anyway” stuff. Let’s start coding!
Well - I wouldn’t necessary call our little tracing.go file a library. It basically wraps some functionality of the go-opentracing library and provides a somewhat clean abstraction with a declarative API to start, stop and parse traces.
There’s a few typical use cases where we need to concern ourselves with tracing info:
Each microservice that wants to transmit tracing results to Zipkin needs to be configured to do that. For that purpose, we’re going to use zipkin-go-opentracing. The code to set this up is very simple:
var tracer opentracing.Tracer

// InitTracing connects the calling service to Zipkin
func InitTracing(zipkinURL string, serviceName string) {
        collector, err := zipkin.NewHTTPCollector(fmt.Sprintf("%s/api/v1/spans", zipkinURL))
        if err != nil {
                panic("Error connecting to zipkin server at " +
                        fmt.Sprintf("%s/api/v1/spans", zipkinURL) + ". Error: " + err.Error())
        }
        tracer, err = zipkin.NewTracer(
                zipkin.NewRecorder(collector, false, "127.0.0.1:0", serviceName))
        if err != nil {
                panic("Error starting new zipkin tracer. Error: " + err.Error())
        }
}
Note the initialization of the package-scoped tracer opentracing.Tracer variable, which is the object we’ll be doing all our tracing work with. The zipkinURL actually comes from our Yaml-based config files stored on github and served to us over Spring Config and Viper:
zipkin_server_url: http://zipkin:9411
As you might notice, we’ll using the http protocol for uploading traces to zipkin. Probably not the most efficient protocol for this purpose. Zipkin also support consumption of AMQP (e.g. RabbitMQ) messages.
As previously stated, we’re going to be using the middleware pattern and context.Context to work with tracing data in incoming HTTP requests. In /accountservice/services/router.go:
func NewRouter() *mux.Router {
        .... other code above ....
		router.Methods(route.Method).
			Path(route.Pattern).
			Name(route.Name).
			Handler(loadTracing(route.HandlerFunc))   // LOOK HERE!
        .... other code below ....
}

func loadTracing(next http.Handler) http.Handler {
	return http.HandlerFunc(func(rw http.ResponseWriter, req *http.Request) {
            span := tracing.StartHTTPTrace(req, "GetAccount")   // Start the span


		    ctx := tracing.UpdateContext(req.Context(), span)   // Add span to context
		    next.ServeHTTP(rw, req.WithContext(ctx))            // Note next-based chaining and copy of context!!
		    span.Finish()                                       // Finish the span
	})
}
What’s going on above? In the NewRouter() we are passing a func loadTracing() to the Handler func of the router builder API. As argument to loadTracing(), we’re passning the func defined in the route. This is actually the “GetAccount” func from handlers.go where we do the actual work.
This looks a lot like interceptors and filter chains familiar from other languages and frameworks, where we “wrap” the call to a function into another function, allowing us to do stuff before and after the actual call - in this case starting a span and then closing it once the “next” func is done. We’ll probably be adding more chaining of handlers in a later blog post where we’ll be adding security and auth checking to our microservices.
The code to start a new HTTPTrace looks like this, e.g. our wrapping of go-opentracing code:
func StartHTTPTrace(r *http.Request, opName string) opentracing.Span {
        carrier := opentracing.HTTPHeadersCarrier(r.Header)                     // 1. Get hold of HTTP headers for tracing from request.
        clientContext, err := tracer.Extract(opentracing.HTTPHeaders, carrier)  // 2. Extract into a tracing context
        if err == nil {                                                         // 3. If there were a tracing context...
                return tracer.StartSpan(                                        // 3.1 Start and return child span of the ongoing one
                        opName, ext.RPCServerOption(clientContext))
        } else {
                return tracer.StartSpan(opName)                                 // 3.2 Otherwise, start a new one from scratch
        }
}
How are we using context to store the “tracing info”, i.e. some correlation id’s and such?
func UpdateContext(ctx context.Context, span opentracing.Span) context.Context {
        return context.WithValue(ctx, "opentracing-span", span)
}
Since the contexts are immutable, we’re using context.WithValue to add the supplied span to our existing context, returning the new context. Note the ugly use of “opentracing-span” as key. I don’t particularly like this pattern with hard-coded keys but at least its only the “tracing.go” code that knows about the key we’re using to fetch the current tracing span from our thread-local substitute - e.g. the context we’re passing around.
So - let’s say our “accountservice” got tracing info when Zuul routed a request to /accounts/{accountId}. Now, we want to continue that trace when the “accountservice” performs a HTTP call to the “imageservice”. This code is quite intermingled with the Circuit-breaker and retry code from the last part, but I hope it makes sense anyway:
// Note how we pass context as 1st param and are passing the HTTP req object as a parameter too.
func PerformHTTPRequestCircuitBreaker(ctx context.Context, breakerName string, req *http.Request) ([]byte, error) {
        output := make(chan []byte, 1)                          // hystrix stuff...
        errors := hystrix.Go(breakerName, func() error {        // hystrix stuff...
                tracing.AddTracingToReqFromContext(ctx, req)    // HERE!!!
                err := callWithRetries(req, output)
                return err     // For hystrix, forward the err from the retrier. It's nil if OK.
        }, func(err error) error {
                return err
        })
... some more code ...
We see that we’re calling tracing.AddTracingToReqFromContext(ctx, req):
 func AddTracingToReqFromContext(ctx context.Context, req *http.Request) {
         if ctx.Value("opentracing-span") == nil {                           // Do nothing if no tracing context available
                 return
         }
         carrier := opentracing.HTTPHeadersCarrier(req.Header)               // Create HTTP carrier for passing tracing data connected to the passed request.
         err := tracer.Inject(                                               // Inject passes span data into the HTTP headers of the request
                 ctx.Value("opentracing-span").(opentracing.Span).Context(), // Note ugly typecast here and use of the hard-coded key...
                 opentracing.HTTPHeaders,
                 carrier)
         if err != nil {
                 panic("Unable to inject tracing context: " + err.Error())   // Here be dragons.
         }
 }
We’ll - I guess the code above isn’t my finest hour, but it basically fetches tracing stuff from the passed context (our substitute for thread-local storage) and passes it into the request object as HTTP headers.
We can of course add child traces without dealing with HTTP headers - we could even pass opentracing.Span structs around as parameters instead of using that ugly context.Context. A really simple use case is when we’re calling our BoltDB to fetch the Account instance. Looks like this:
// Note that we're passing the context as 1st param, just as Google asks us to!
func (bc *BoltClient) QueryAccount(ctx context.Context, accountID string) (model.Account, error) {

        // Tracing code.
        span := tracing.StartChildSpanFromContext(ctx, "QueryAccount")    // Start a child span of the current one,
                                                                          // named QueryAccount
        defer span.Finish()      // Note use of defer, e.g. the span won't be finished and uploaded to Zipkin until
                                 // the ongoing func has finished. (we could also put span.Finish() at the very last
                                 // line of this func.

        account := model.Account{}
        err := bc.boltDB.View(func(tx *bolt.Tx) error {
            ......... more code .........
        }
See comments for details.
A quick peek at this particular trace in Zipkin:
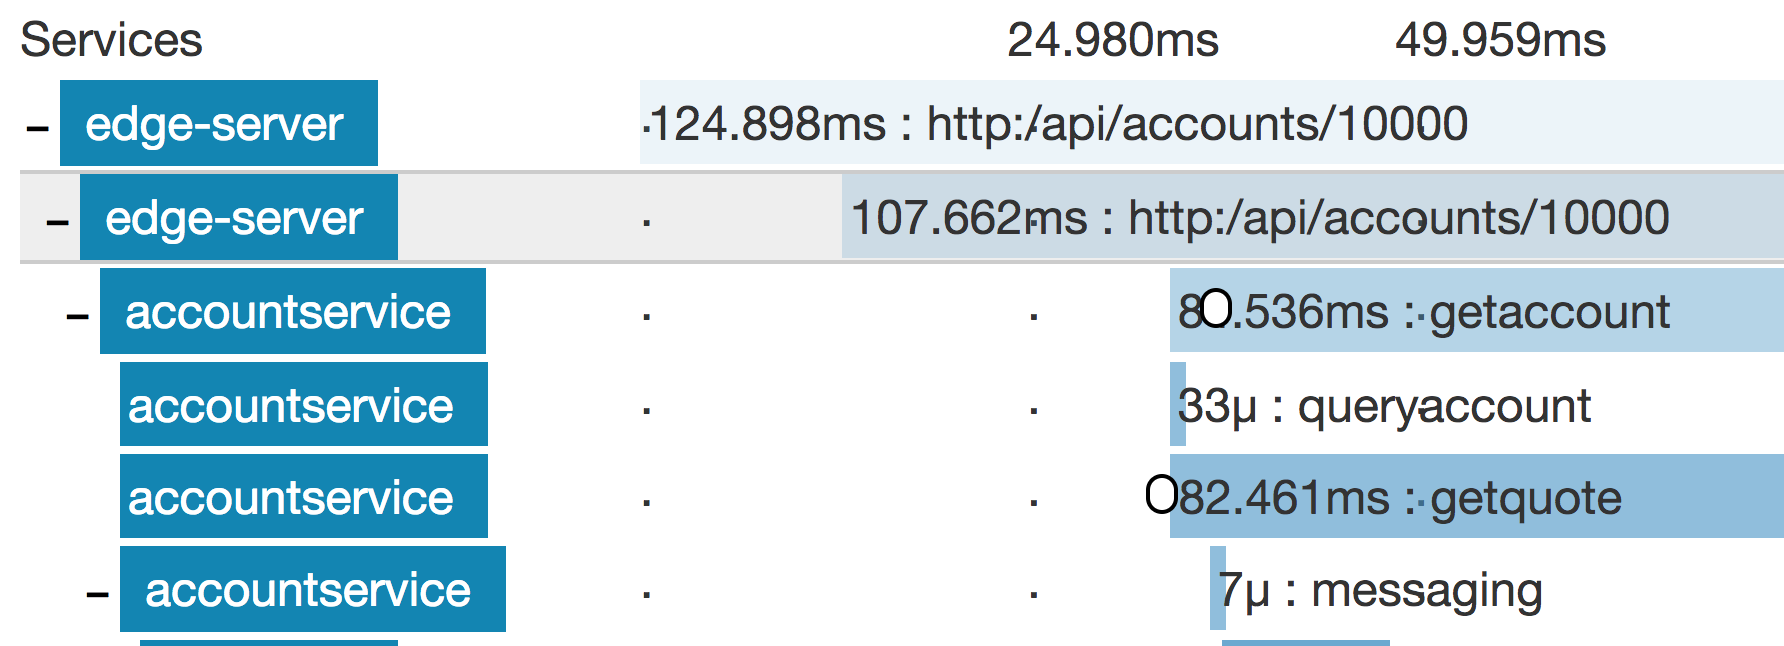
Yes, it’s the tiny one using 33 microseconds just below the middle, with “accountservice” as its parent. We’ll look more closely at Zipkin very soon.
There’s a number of other code changes for this part of the blog series. The key changes being introduction of context.Context as 1st parameter, passing of trace id’s (e.g. spans) across microservices using HTTP or AMQP headers and each microservice uploading traces to Zipkin using HTTP.
Let’s get this show on the road, shall we? We’ve already covered deployment of Netflix Zuul and Zipkin. Also make sure you’ve checked out branch P12 of the source code repo. Given that we’ve got a working Go environment (remember GOPATH) and Docker running (don’t forget to eval “$(docker-machine env swarm-manager-0)” etc.), we can continue by rebuilding all our go microservices using the “./copyall.sh” shell script:
> ./copyall.sh
built /Users/myuser/goblog/src/github.com/callistaenterprise/goblog/accountservice
built /Users/myuser/goblog/src/github.com/callistaenterprise/goblog/vipservice
... and so on ...
This should build all go-based microservices and deploy them to our Swarm. Let’s take a look at dvizz on http://192.168.99.100:6969:
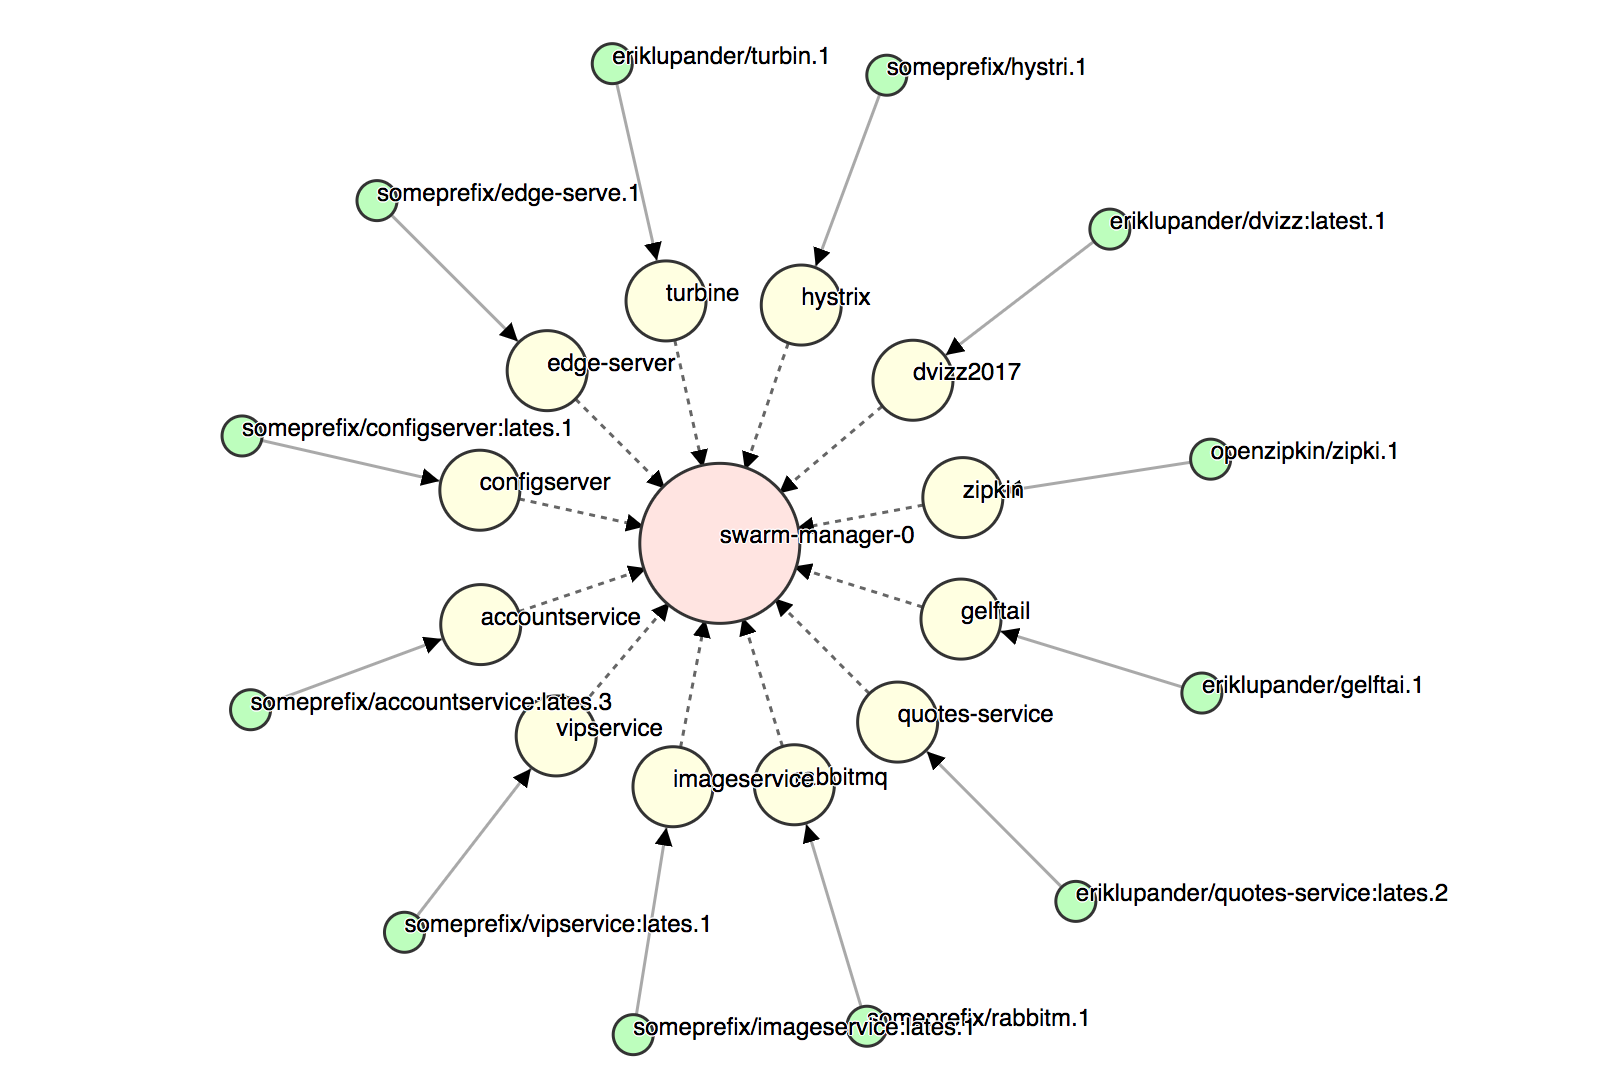
Quite a few services! Time to do a few requests using curl to the Edge server and see if we can get some traces into zipkin!
We’ll use curl to request /api/accounts/10000 which is the endpoint served by our Zuul Edge server. Internally, the flow of requests should be like this:
Run a few calls using url:
curl -k https://192.168.99.100:8765/api/accounts/10000
(the -k flag is to ignore SSL warnings, I’m running Zuul with a self-signed cert)
Open the zipkin GUI at http://192.168.99.100:9411 and click the “Find traces” button:
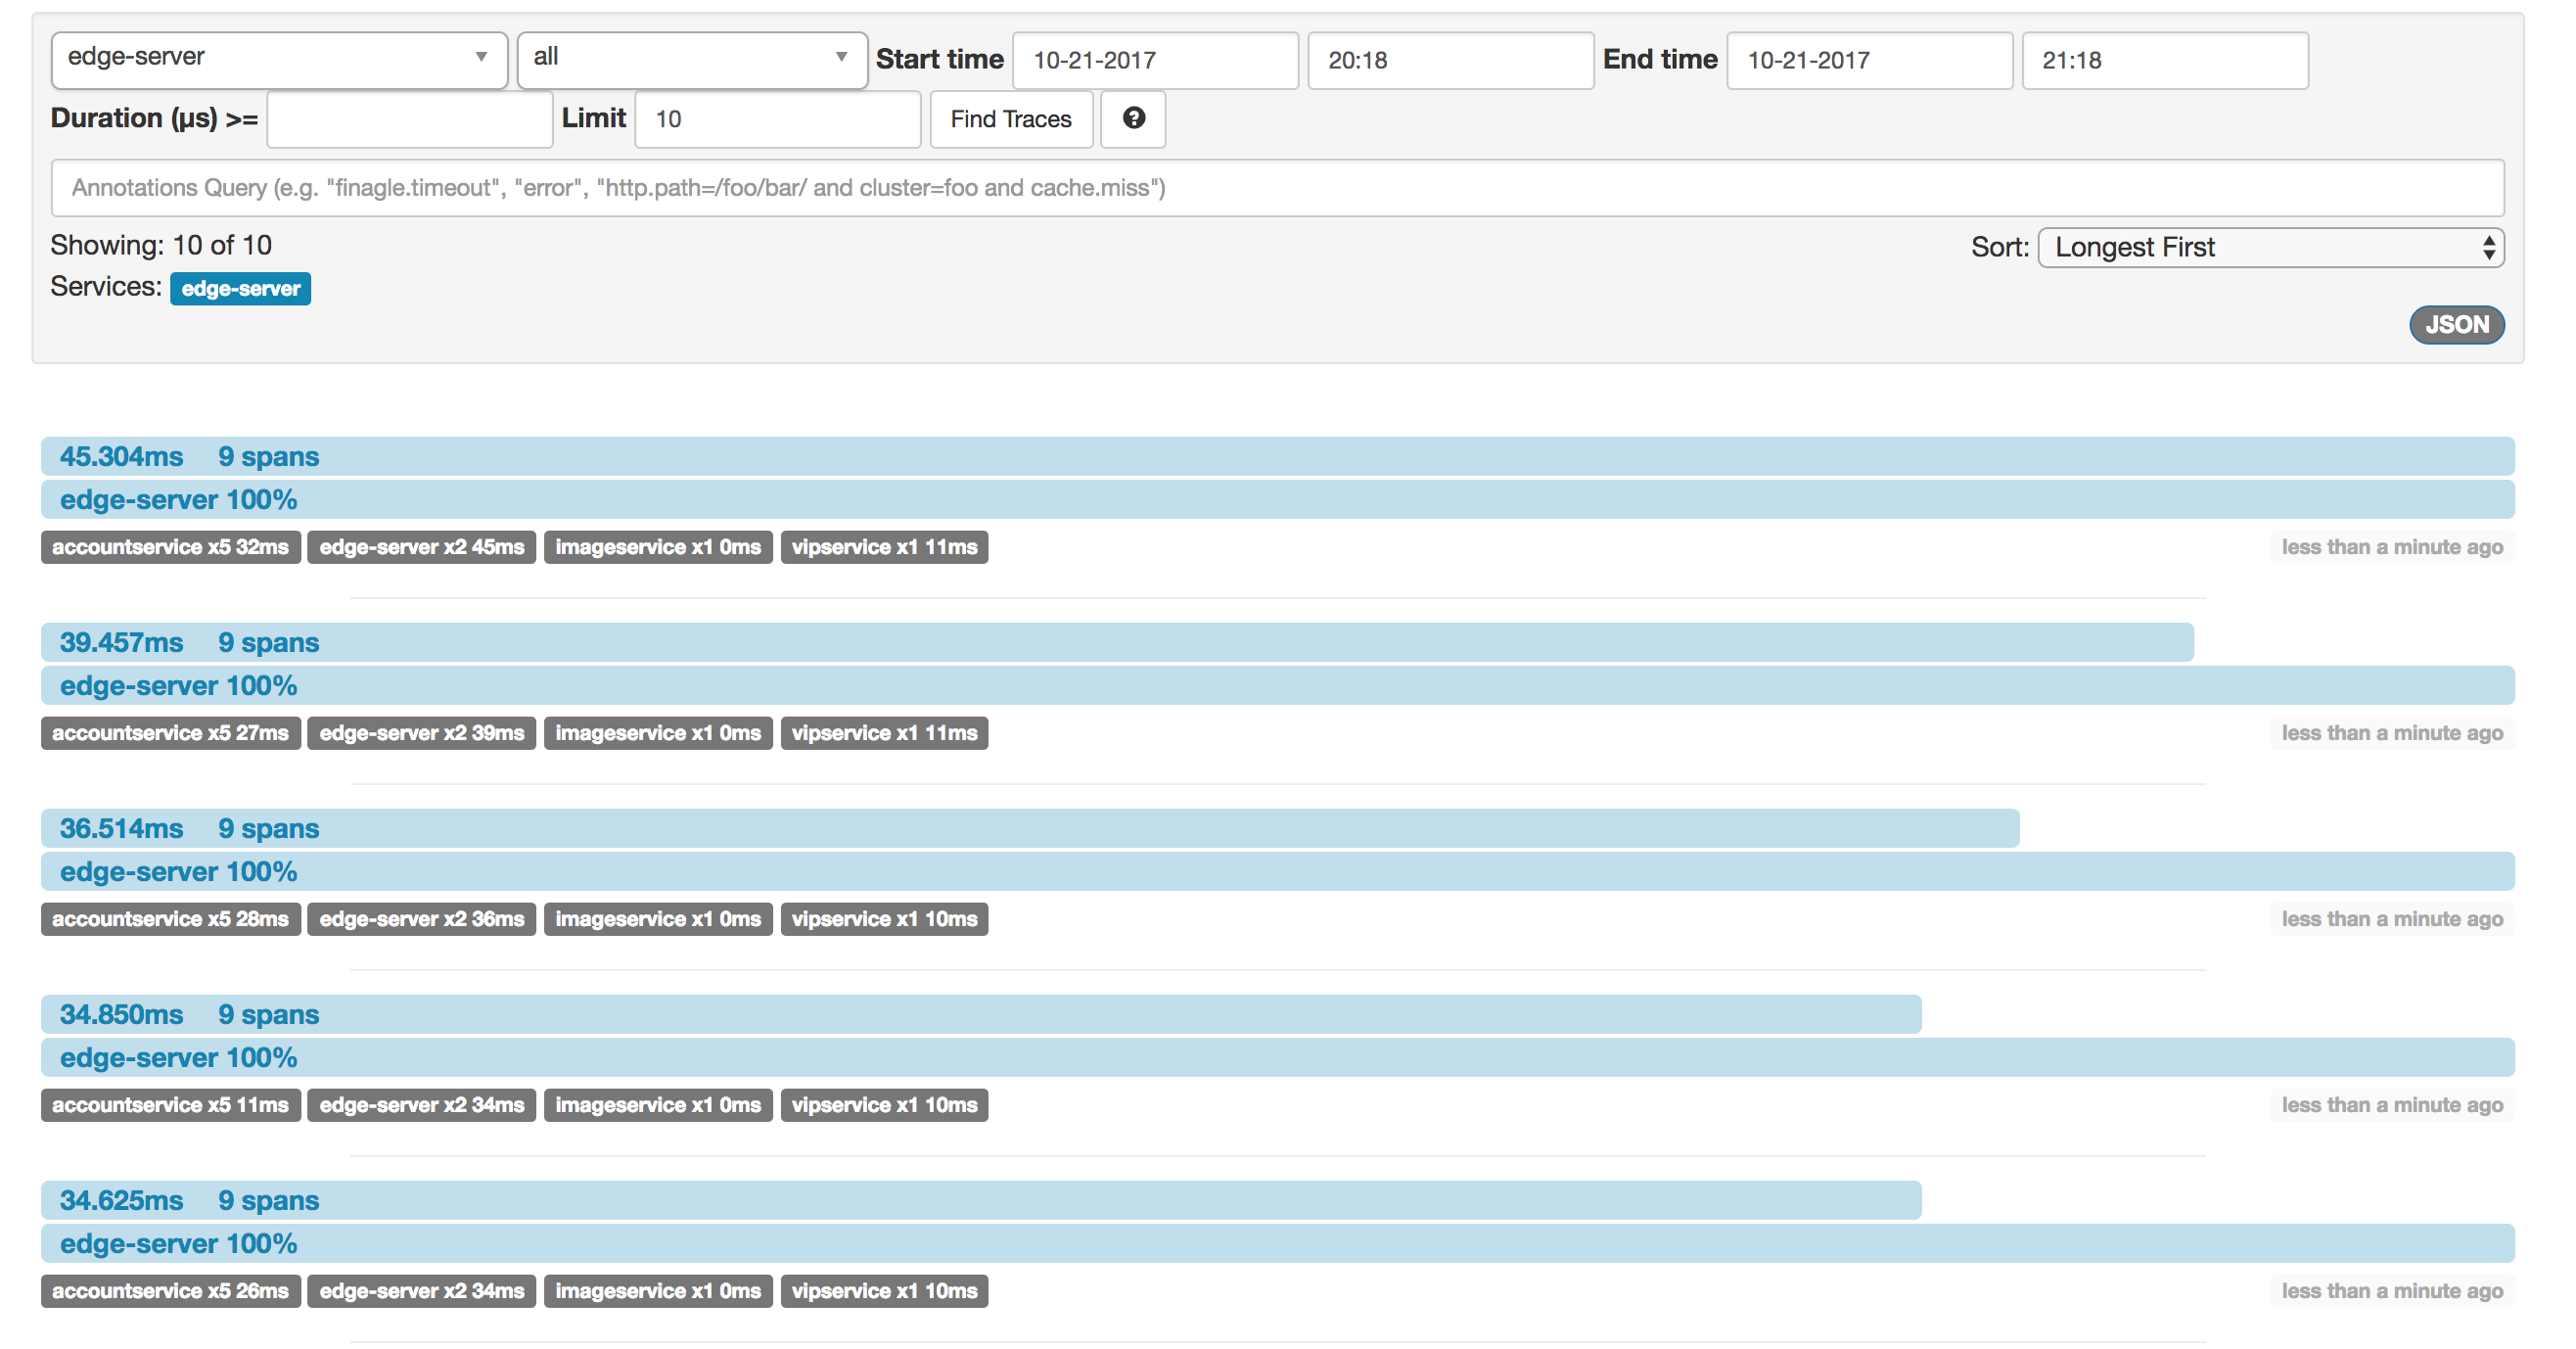
Cool! The traces are there right away. We see that the longest request needed about 45ms from start (in the EDGE server) to finish (when the EDGE server responded to curl). The 45ms trace is made up of 9 spans with varying lengths. By clicking on the topmost trace, we can examine it in more detail:
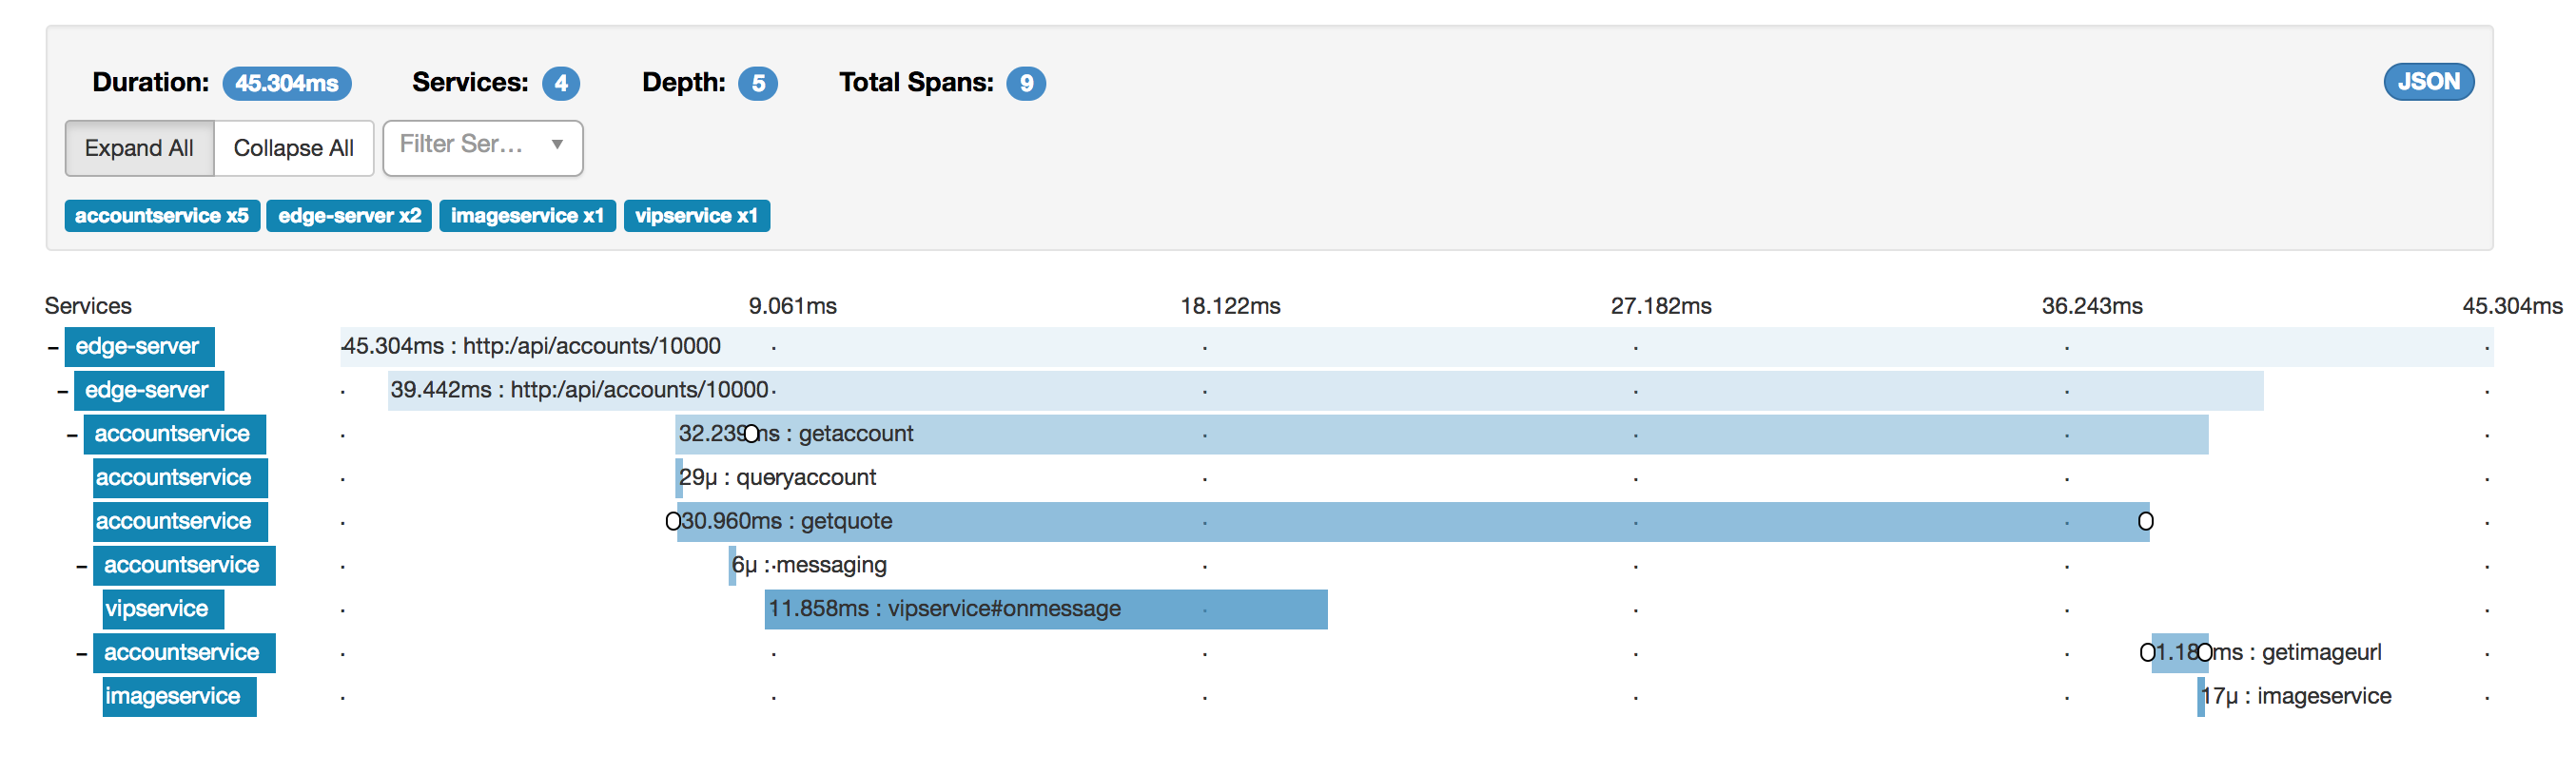
Examine the trace above closely. If we are troubleshooting performance issues, it should be relatively straightforward to spot the most likely culprit for most of the 45ms duration.
Remember, when reading the trace, the topmost spans are usually spending most of their time waiting for sub-services to finish. We should pay special attention to leaf operations taking a lot of time. Let’s see:
Since the getquote span makes up 30 ms of the total 32 ms of the getaccount span, we can probably say for certain that the quotes-service is guilty.
(In this case, we shouldn’t blame Java. You might remember from a few blog posts back that we send a ?strength=4 query param to the _quotes-service that makes it use CPU cycles artificially to simulate work.)_
Needless to say, a tool such as Zipkin can be invaluable for identifying both which services that’s invoked when your microservices are serving a request as well as identifying where time is being spent.
It’s also possible to click on the individual spans for even more detail. A cool thing about opentracing and zipkin is that you can attach both arbitrary key-value pairs as well as “log events” to spans that ends up in Zipkin. Here we see Zuul providing some extra info for us:
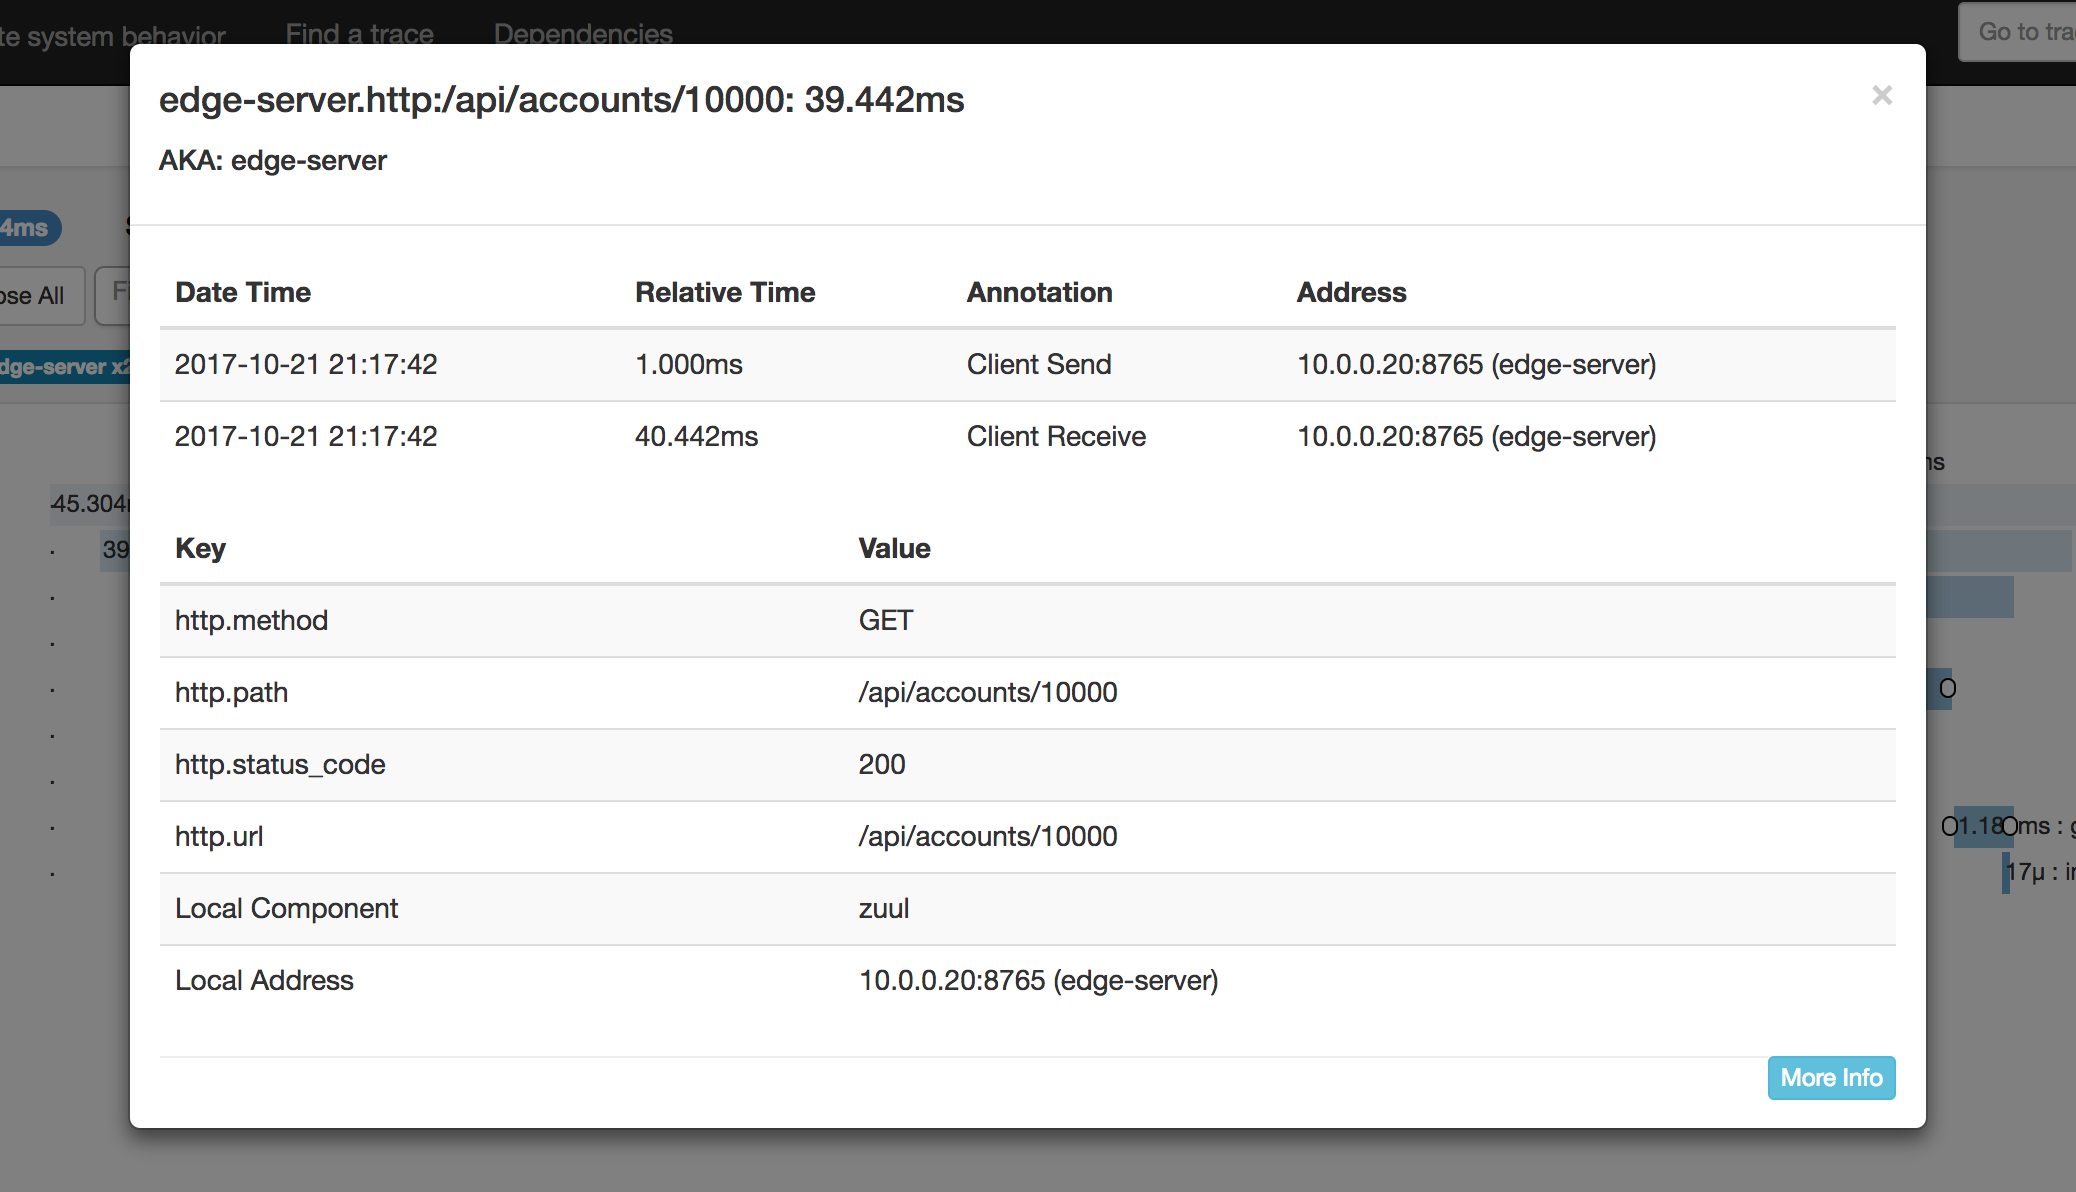
Of course, we can add this kind of stuff in Go code too.
Let’s take a quick peek at resource usage, we’ve added quite a bit of code in the last parts in regard to circuit breakers, tracing, configuration, logging etc:
CONTAINER                                    CPU %               MEM USAGE
imageservice.1.fcaax3b2coexljqs82l72sw6q     2.13%               4.496MiB
accountservice.3.ma5x5r9wzkkfippr5lg1rucce   0.22%               4.445MiB
vipservice.1.ydi9g7qg5fx6841dznzhlynk1       1.93%               3.418MiB
Our go services are still lean.
In a few blog posts, I plan to deploy all of the above using AWS CloudFormation and Docker Stack to an Amazon EC2 cluster made up of t2.micro instances. There, we will really start to notice the impact of resource-friendly services when we start to scale stuff.
In this part of the blog series we’ve added distributed tracing to our Go microservices and added an EDGE server (Zuul) and Zipkin for collecting and viewing traces.
In part 13 we’ll take a look at using Go with CockroachDB and the O/R-mapper GORM.
Please help spread the word! Feel free to share this blog post using your favorite social media platform, there’s some icons below to get you started.
Until next time,
// Erik