Blogg
Här finns tekniska artiklar, presentationer och nyheter om arkitektur och systemutveckling. Håll dig uppdaterad, följ oss på LinkedIn
Här finns tekniska artiklar, presentationer och nyheter om arkitektur och systemutveckling. Håll dig uppdaterad, följ oss på LinkedIn

This is the second part of a short blog-series about using CDK and AWS services to build and deploy a personal solution for monitoring electricity usage. In this part, we’ll look more closely at the Golang-based lambdas.
The full CDK and Go source code for this project can be found here: https://github.com/eriklupander/powertracker
Note: I am in no way affiliated with or working for Tibber, Easee, AWS or any other company or service provider mentioned in this blog post. I’m only doing this for educational purposes and personal enjoyment.
As a short recap from part 1, here’s the system overview:
![]()
Let’s take a look at the inner workings of the golang-based PowerRecorder lambda. Back in section 1.1 of the first post, the overall chain of events was defined - i.e. the PowerRecorder connects to the Tibber API, fetches a liveMeasurement and stores the retrieved value in AWS Timestream. So how did we actually go about implementing all that stuff in a Golang-based Lambda?
First off - the boilerplate required for running a Golang lambda is very simple. In one’s main.go, the following is sufficient for a hello-world like lambda:
// Is invoked on each invocation of the lambda
func handler(ctx context.Context) error {
	fmt.Println("Hello World!")
	return nil
}

// main is called when a new lambda is bootstrapped, so don't
// expect to have something done for every query here.
// How and when AWS bootstraps/cleans up lambda functions is
// (from our point of view) undefined.
func main() {
	lambda.StartWithContext(context.Background(), handler)
}
In order to access my house’s data on Tibber, I need an API key (details here). I fired up AWS Secrets Manager and created a single secret that consists of two KV-pairs:
{
  "tibber_api_key": "some-long-and-very-opaque-api-key",
  "tibber_home_id": "some-uuid-which-identifies-my-home"
}
To access this from Go code, I need two things:
arn:aws:secretsmanager:*:secret:prod/tibber_config-* with action secretsmanager:GetSecretValue which we set up in our CDK code.func getSecret(secretName string) (string, error) {
s := session.Must(session.NewSession())
sm := secretsmanager.New(s)
output, err := sm.GetSecretValue(&secretsmanager.GetSecretValueInput{SecretId: &secretName})
if err != nil {
return "", err
}
return *output.SecretString, nil
}
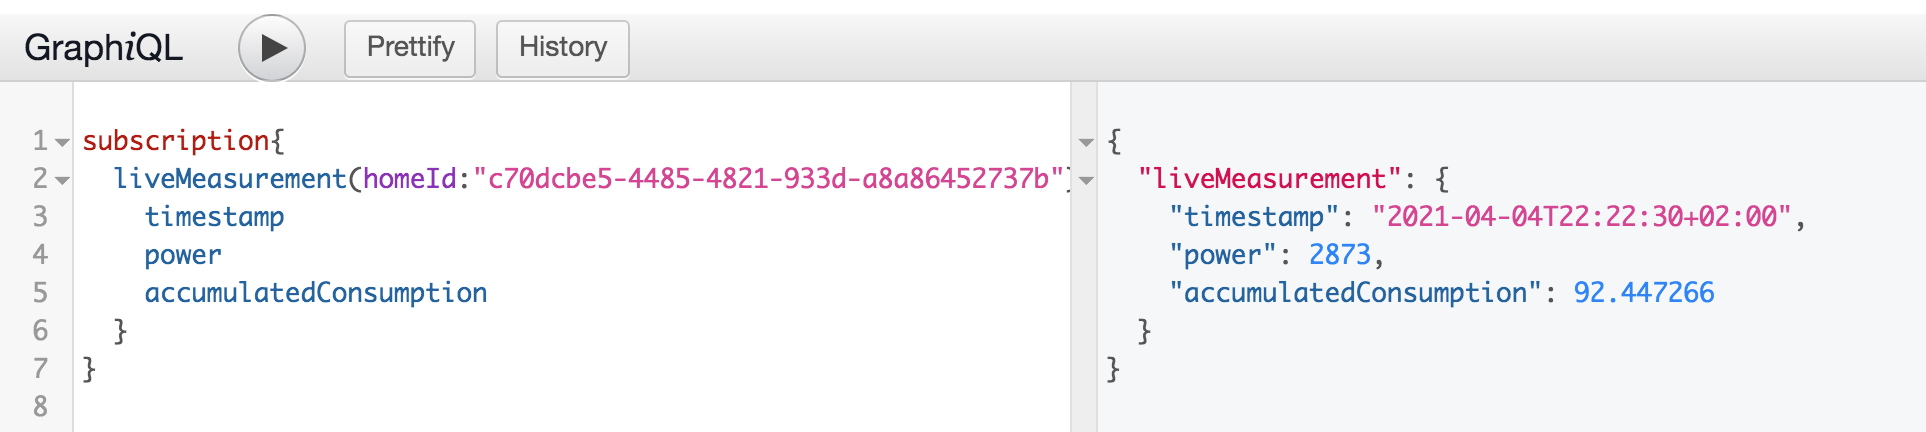
The Tibber API is based around GraphQL. Most data can be accessed using their “plain” query API, but in order to access data from your Watty box, a GraphQL subscription is needed. Tibber has a GraphiQL API explorer one can use to play around with both one’s real data or with a fake API key. You can find it here
Many GraphQL solutions for Go are based around github.com/graphql-go/graphql. However, I found a slight lack of documentation on GraphQL subscription clients, so some further searching turned up github.com/hasura/go-graphql-client which in its turn is a fork of github.com/shurcooL/graphql with well-documented support for GraphQL subscriptions. The github.com/hasura/go-graphql-client fork provides a really nice and Go-ish API in order to set up and consume subscription data.
const tibberGQLSubscriptionUrl = "wss://api.tibber.com/v1-beta/gql/subscriptions"

func recordPowerUsageFromWatty(accessToken, homeId string) error {

	// Set up the subscription client.
	subscriptionClient := graphql.NewSubscriptionClient(tibberGQLSubscriptionUrl).
		WithConnectionParams(map[string]interface{}{
			"token": accessToken,
		})
	defer subscriptionClient.Close()

	// GraphQL variable for "homeId"
	variables := map[string]interface{}{
		"homeId": graphql.ID(homeId),
	}

	// Channel to pass data from subscription callback to "main" goroutine
	dataChan := make(chan *subscription)

	// Subscribe to real-time power usage
	id, err := subscriptionClient.Subscribe(&subscription{}, variables, func(dataValue *json.RawMessage, errValue error) error {
		m := &subscription{}
		if err := json.Unmarshal(*dataValue, m); err != nil {
			return errors.Wrap(err, "unmarshalling measurement")
		}
		// pass data to channel
		dataChan <- m
		return nil
	})
	if err != nil {
		return errors.Wrap(err, "starting subscription")
	}

	// finally run the subscription in a goroutine. If start fails, we'll pass nil to the dataChan.
	go func() {
		err = subscriptionClient.Run()
		if err != nil {
			logrus.WithError(err).Error("error calling Run()")
			dataChan <- nil // pass nil in order to cancel select below
		}
	}()

	// block here until we have data. Once we get data or time out, unsubscribe and exit.
	select {
	case sub := <-dataChan:
		if sub != nil {
			ingest(record{HomeId: homeId, AccumulatedConsumption: float64(sub.LiveMeasurement.AccumulatedConsumption)})
		}
	case <-time.NewTimer(time.Second * 10).C:
	}
	if err := subscriptionClient.Unsubscribe(id); err != nil {
		logrus.WithError(err).Error("error occurred trying to unsubscribe from subscription")
	}
	return nil
}

// subscription forms the root of our GraphQL query having a homeId parameter.
type subscription struct {
	LiveMeasurement liveMeasurement `graphql:"liveMeasurement(homeId: $homeId)"`
}
// liveMeasurement forms the timestamp + accumulated usage part of the GraphQL query
type liveMeasurement struct {
	Timestamp              graphql.String `graphql:"timestamp"`
	AccumulatedConsumption graphql.Float  `graphql:"accumulatedConsumption"`
}
Some notable details:
select block.subscription struct used as GQL query into discrete structs. It seems to be quite common to use anonymous structs for GraphQL query objects.accessToken and homeId arguments comes from AWS Secrets Manager.As seen in the code above, we have a call to ingest(record{HomeId: homeId, AccumulatedConsumption: float64(sub.LiveMeasurement.AccumulatedConsumption)}) where we pass our accumulated consumption. This is actually a per-day value that’s reset at 00:00 local time and we use it to measure the average power used over the last 5 minutes, more on that in the next section about the exporter lambda.
Again, our lambda needs some IAM permissions: Action timestream:* and Resource *. In this case this IAM permission allows our PowerRecorder lambda to do any timestream action on any (timestream) resource.
The code is slightly verbose so I’ll just show some of the most interesting parts. The full source is available here
// record represents a single measurement
type record struct {
    HomeId                 string
    AccumulatedConsumption float64
}

func ingest(rec record) {
	// a lot of timeouts omitted
	if err := http2.ConfigureTransport(&http.Transport{}); err != nil {
		logrus.WithError(err).Error("error configuring HTTP transport")
		return
	}

	// set up an AWS session
	sess, err := session.NewSession(&aws.Config{Region: aws.String("eu-west-1"), MaxRetries: aws.Int(3), HTTPClient: &http.Client{Transport: tr}})
	if err != nil {
		logrus.WithError(err).Error("error creating AWS session")
		return
	}

	// Set up timestreamwrite writer
	writeSvc := timestreamwrite.New(sess)

	// Invoke the writeData func with the passed record and the write service
	databaseName := "powertracker"
	tableName := "power_record"
	writeData(writeSvc, databaseName, tableName, rec)
}
We do create a new HTTP transport and AWS session on each invocation, but that kind of makes sense here since we never expect to be called more often than once every 5 minutes.
func writeData(writeSvc *timestreamwrite.TimestreamWrite, databaseName string, tableName string, rec record) {
writeRecordsInput := ×treamwrite.WriteRecordsInput{
DatabaseName: aws.String(databaseName),
TableName: aws.String(tableName),
Records: []*timestreamwrite.Record{
{
Dimensions: []*timestreamwrite.Dimension{
{Name: aws.String("homeId"), Value: aws.String(rec.HomeId)},
},
MeasureName: aws.String("energy_used"),
MeasureValue: aws.String(strconv.FormatFloat(rec.AccumulatedConsumption, 'f', 6, 64)),
MeasureValueType: aws.String("DOUBLE"),
Time: aws.String(strconv.FormatInt(time.Now().Unix(), 10)),
TimeUnit: aws.String("SECONDS"),
},
},
}
if _, err := writeSvc.WriteRecords(writeRecordsInput); err != nil {
logrus.WithError(err).Error("error writing power usage records")
}
}
The AWS timestream writer API is as previously stated a bit verbose. We first prepare a WriteRecordsInput with a single Record that consists of a timestream Dimension which is a kind of metadata about records.
Next we pass our actual measurement “energy_used” as a DOUBLE as well as the moment in time as time.Now().Unix() as SECONDS TimeUnit. See more on records here.
Finally, we call writeSvc.WriteRecords(writeRecordsInput) which should make our measurement end up in our timestream database table:
A quick query using the AWS Console for Timestream shows that this is indeed working:
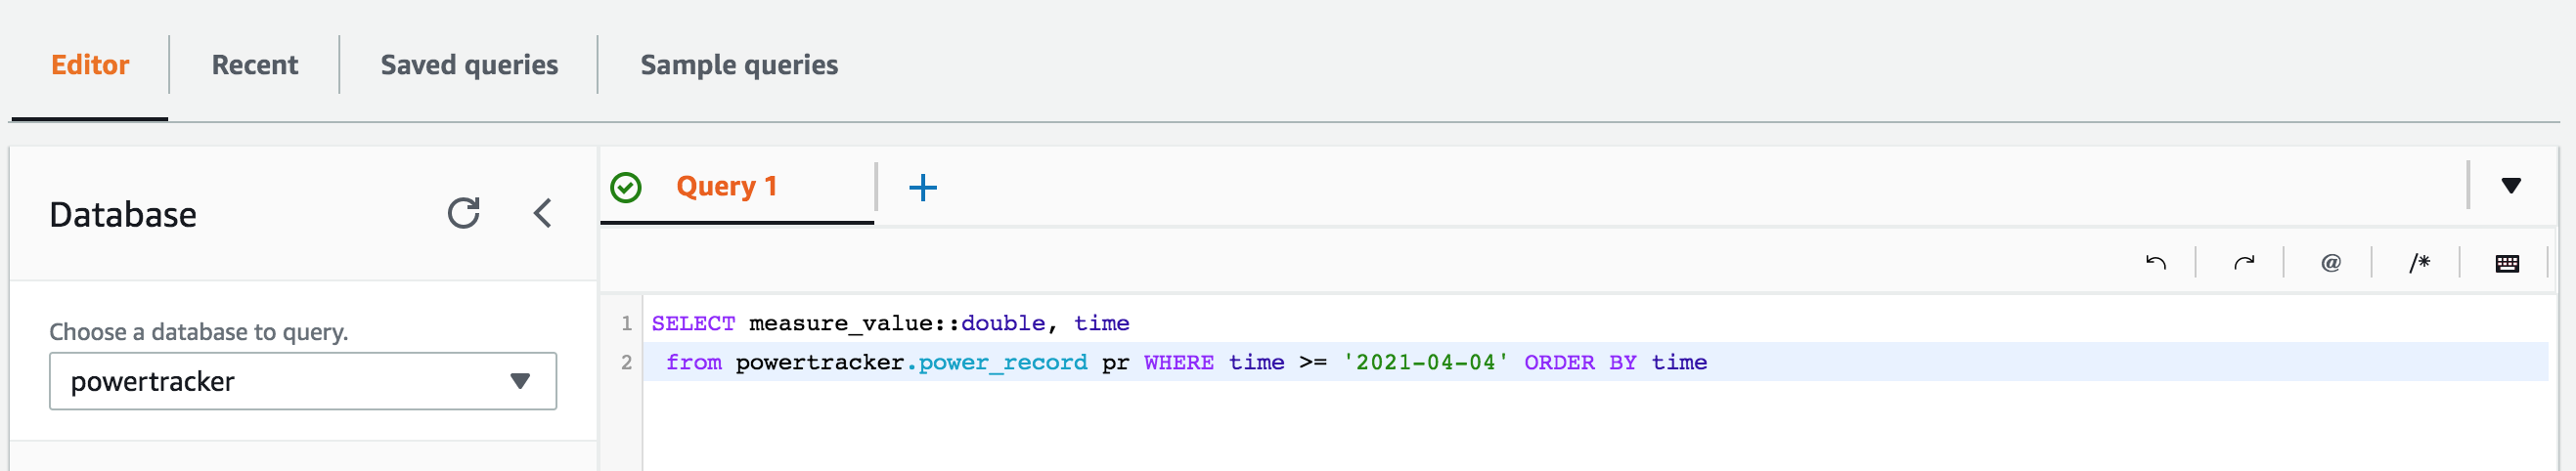
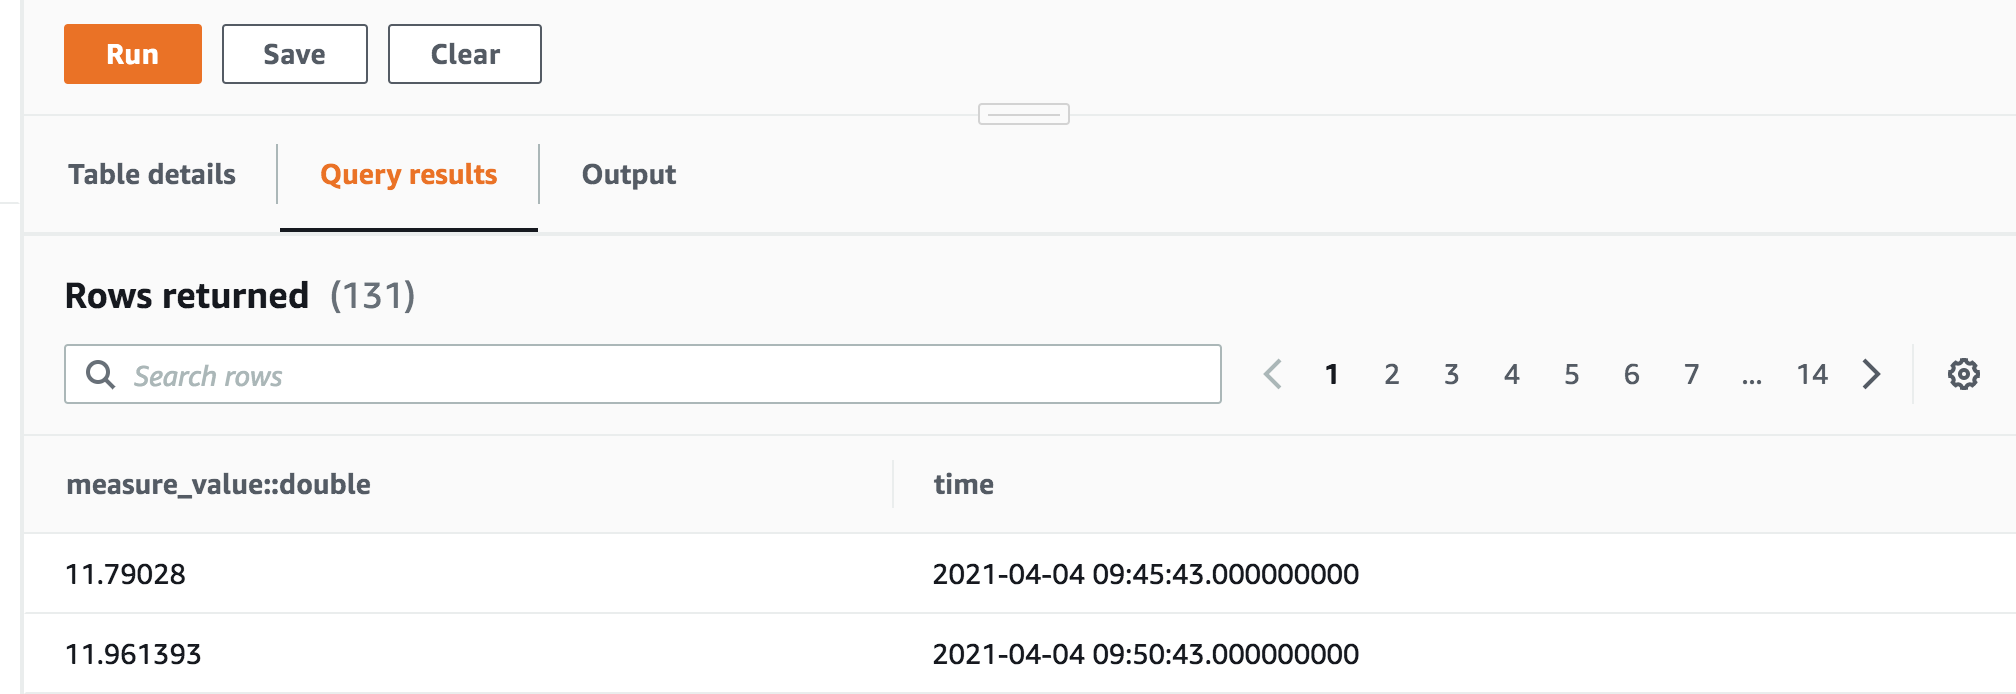
Now we have a lot of measurements sitting in AWS Timestream waiting to be transformed into something useful for keeping track of my electricity usage.
There’s certainly a ton of options one could explore. In my case, I chose to implement a simple “Exporter API” capable of either producing a CSV file one could import into Excel or similar, as well as some simple graphs as .PNG images.
I’ve named this lambda exporter and it’s declared together with an AWS API Gateway using CDK (see part 1), implemented in Go.
Let’s start with the boilerplate, which in this case is slightly different from your average Go AWS Lambda since I utilize the AWS Lambda Chi Adapter so I can take advantage of chi’s powerful router features and composable middlewares:
var chiLambda *chiadapter.ChiLambda

// handler is invoked whenever this lambda executes.
func handler(ctx context.Context, req events.APIGatewayProxyRequest) (events.APIGatewayProxyResponse, error) {
	return chiLambda.ProxyWithContext(ctx, req)
}

// main is called when a new lambda is constructed, note how we set up the chi router and that we pass our timestream
// DataSource into it.
func main() {
	chiLambda = chiadapter.New(setupRouter(timestream.NewDataSource()))
	lambda.StartWithContext(context.Background(), handler)
}
The neat thing here is how chiLambda.ProxyWithContext(ctx, req) proxies the AWS lambda APIGatewayProxyRequest into a plain HTTP request that Chi understands in my simple piece of router code:
func setupRouter(source DataSource) *chi.Mux {

	r := chi.NewRouter()
	r.Use(middleware.RequestLogger(&middleware.DefaultLogFormatter{Logger: logrus.New()}))

	r.Get("/", handle(source))
	r.NotFound(func(w http.ResponseWriter, r *http.Request) {
		w.WriteHeader(http.StatusNotFound)
		_, _ = w.Write([]byte(fmt.Sprintf("The requested path %s was not found", r.RequestURI)))
	})
	return r
}
Note how we’re adding a chi handler for / as that’s what will be forwarded to us from the HTTP API Gateway. I’ve also added a simple chi middleware which will log incoming requests using logrus, which (truncated and formatted for brevity) gives us request log statements such as this one in AWS CloudWatch Logs:
msg="\"GET http://<removed>.execute-api.eu-west-1.amazonaws.com/?from=2021-03-26&to=2021-04-02&graph=hist&output=pngaggregate=5m
HTTP/1.1\" from  - 200 59625B in 2.840281654s"
Next, here’s the business logic in that handle(source) func:
Let’s go through steps 2 and 4 in more detail.
Remember that we record the day’s accumulated power use every five minutes, which we then calculate a diff from, to find out how many kWh that were used over the last 5 minutes.
11.961393	2021-04-04 09:50
12.049608	2021-04-04 09:55
12.156595	2021-04-04 10:00
While it would be possible to first look up the last record when writing data to our timestream table and directly store the “diff” when writing the new one, that would entail a potentially costly timestream query every five minutes. Instead, when the exporter Lambda is invoked, we read all data in the requested timeframe and calculate the difference between each measurement on the fly.
The Go code for setting up a AWS Timestream connection and IAM permissions is identical to that which the PowerRecorder lambda used. However, querying is another matter so let’s take a look at how to create and execute a Timestream query, and then transform the query results into our own model.Entry struct used as internal data representation inside the exporter lambda:
func (s *Source) buildQuery(fromStr string, toStr string) string {
query := "SELECT pr.homeId, pr.measure_value::double, pr.time FROM powertracker.power_record pr"
// apply some semi-ugly date predicates if applicable
if fromStr != "" || toStr != "" {
from, fromErr := time.Parse("2006-01-02", fromStr)
to, toErr := time.Parse("2006-01-02", toStr)
if fromErr == nil && toErr == nil {
query += " WHERE pr.time > '" + from.Format("2006-01-02") + "' AND pr.time < '" + to.Format("2006-01-02") + "'"
} else if toErr == nil {
query += " WHERE pr.time < '" + to.Format("2006-01-02") + "'"
} else if fromErr == nil {
query += " WHERE pr.time > '" + from.Format("2006-01-02") + "'"
}
}
query += " ORDER BY pr.time"
return query
}
func (s *Source) GetAll(fromStr, toStr string) ([]model.Entry, error) {
idempotencyKey := uuid.New().String()
query := buildQuery(fromStr, toStr)
output, err := s.querySvc.Query(×treamquery.QueryInput{ClientToken: &idempotencyKey, QueryString: &query})
if err != nil {
return nil, err
}
// rest coming...
Wow! That looks like plain SQL (except for that pr.measure_value::double) like we wrote it back in 2003! Yes, I kind of despise those if…else statements that applies the to and from query parameters only if they’re valid ISO-8601 dates - but it works OK for this purpose.
The resulting timestreamquery.QueryOutput contains a slice of timesstreamquery.Row we can iterate over.
    entries := make([]model.Entry, 0)     // storage for the output
	lastAccumulativeValue := -1.0         // variable used to calculate the difference from the last record
	currentUsage := 0.0                   // variable of storing the difference

	for _, row := range output.Rows {

		// Extract values from the output rows.
		homeId := *row.Data[0].ScalarValue
		measure, err := strconv.ParseFloat(*row.Data[1].ScalarValue, 64)
		if err != nil {
			return nil, err
		}
		created, err := time.Parse("2006-01-02 15:04:05", *row.Data[2].ScalarValue)
		if err != nil {
			return nil, err
		}

		// this kludge is to handle the first entry where there's no previous entry to calc diff against
        if lastAccumulativeValue == -1.0 {
            currentUsage = 0.0
        } else {
            // day switch, then the measurement drops to 0 again.
            if measure < lastAccumulativeValue {
                lastAccumulativeValue = 0.0
                currentUsage = 0.0
            } else {
                currentUsage = measure - lastAccumulativeValue
            }
        }

		entries = append(entries, model.Entry{
			HomeId:           homeId,
			CurrentUsage:     measure - lastAccumulativeValue,
			AccumulatedDaily: measure,
			Created:          created,
		})
		lastAccumulativeValue = measure
	}

	return entries, nil
In all honesty I’m not particularly proud of the code above, and I’m quite sure there are better ways to handle both extracting data from the Rows and handling the diff calculation between entries. Nevertheless - it does work, so over to the aggregation phase.
I guess Go isn’t a programming language with an abundance of high-quality libraries for drawing different kinds of plots or graphs. A quick look at Awesome Go’s list of libraries for data science shows that such a library is gonum/plot which is the stand-alone plotting/graphing library of the general-purpose computing library gonum.
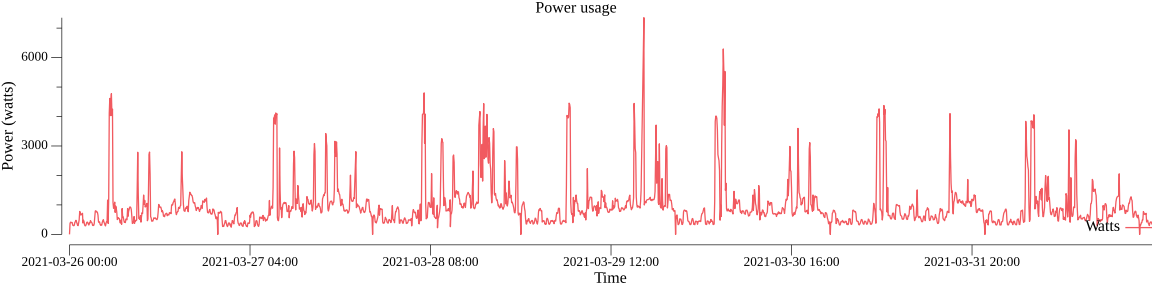
For the exporter lambda I chose to support two types of graphs: lineplots and histograms:
Lineplot:
Histogram:
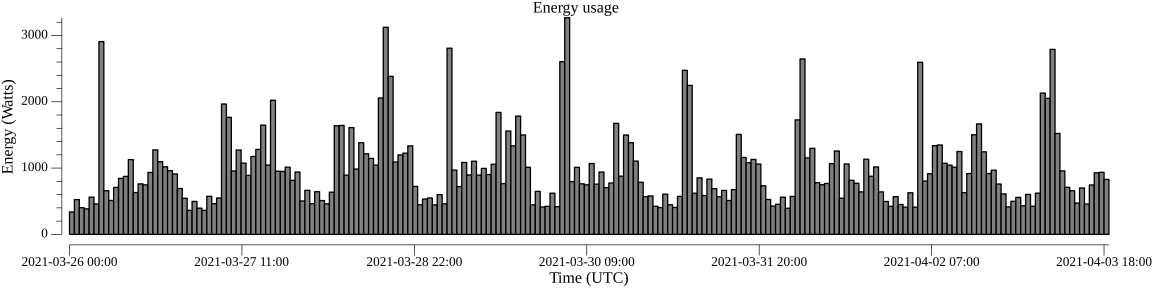
The programming model is quite similar, let’s focus on the histogram:
func ExportHist(entries []model.Entry) ([]byte, error) {
	// 1. Start by transforming to plotter.XYs format, passing timestamp as unix time.
	var pts plotter.XYs
	linq.From(entries).Select(func(i interface{}) interface{} {
		entry := i.(model.Entry)
		return plotter.XY{X: float64(entry.Created.Unix()), Y: entry.CurrentUsage}
	}).ToSlice(&pts)

	// 2. Create a histogram plot, passing the data
	hist, err := plotter.NewHistogram(pts, len(pts))
	if err != nil {
		return nil, err
	}

	// 3. Add labels and some min/max values for the X / Y axises.
	p := plot.New()
	p.Title.Text = "Energy usage"

	p.X.Label.Text = "Time (UTC)"
	p.X.Min = float64(entries[0].Created.Unix())
	p.X.Tick.Marker = NewUTCDateTimeTicks(6.0)

	p.Y.Label.Text = "Energy (Watts)"
	p.Y.Min = 0.0
	p.Y.Max = linq.From(entries).Select(func(i interface{}) interface{} {
		return i.(model.Entry).CurrentUsage
	}).Max().(float64)

	// 4. Add our histogram to the plot and generate a PNG image
	p.Add(hist)
	return toPNG(p)
}
This quite simplistic func takes a slice of entries where each entry represents (after aggregation) the average power in Watts used during the aggregated time period - typically 5 minute, 1 hour or 1 day.
To spice things up a little while we wait for type parameters to be implemented, I’m using a bit of go-linq to transform our []model.Entry structs into the gonum/plot plotter.XYs using some functional-style code. go-linq is also used to conveniently find the Max() value for the Y-axis without manual iteration.
The use of gonum/plot above is quite vanilla except that p.X.Tick.Marker = NewUTCDateTimeTicks(6.0). That’s a customization I made in order to better control how the date/time’s are rendered on the X-axis:
func (u UTCDateTimeTicks) Ticks(min, max float64) []plot.Tick {
	if max <= min {
		logrus.Fatal("illegal range")
	}
	start := time.Unix(int64(min), 0)
	end := time.Unix(int64(max), 0)
	end = end.Add(time.Hour)                       // add an extra hour so the max becomes "inclusive" when rendering a full day.

	stepHours :=  end.Sub(start).Hours() / u.Steps // find out how may hours to increase for each tick / step
	var ticks []plot.Tick
	d := time.Unix(start.UTC().Unix(), 0).Truncate(time.Minute) // truncate to minute
	for d.Before(end) {
		ticks = append(ticks, plot.Tick{Value: float64(d.UTC().Unix()), Label: d.UTC().Format("2006-01-02 15:04")})
		d = d.Add(time.Duration(stepHours) * time.Hour)
	}
	return ticks
}
The Ticks method is invoked by gonum/plot where it will pass the first (min) unix timestamp and the last (max) unix timestamp.
We then use a (perhaps oversimplistic) algorithm to figure out how many hours to put between each “tick” on the X-axis. The u.Steps can be set depending on how dense markers one wants as well as the anticipated width of the graph as well width of each tick “text” such as a full ISO8601 datetime. The downside of this simple approach is that timestamps for the ticks can end up being a quite “uneven” number of hours apart, e.g. 01:00, 06:00 while it’s more aesthetically pleasing to have 6, 12 or perhaps 24 hours between each “tick” or perhaps every 7 days for a month-long plot. I better implementation should probably adjust the min/max values depending on number of “ticks” as well as total duration to get full hours, 12 hours, 24 hours etc per tick.
The final snippet to turn our plot into a PNG image uses the lovely Go’ish pattern of creating a gonum/plot writer that lets us WriteTo(..) anything that implements io.Writer, in our case a *bytes.Buffer.
func toPNG(p *plot.Plot) ([]byte, error) {
	buf := new(bytes.Buffer)
	pngWriter, err := p.WriterTo(12*vg.Inch, 3*vg.Inch, "png")
	if err != nil {
		return nil, err
	}
	_, err = pngWriter.WriteTo(buf)
	if err != nil {
		return nil, err
	}
	return buf.Bytes(), nil
}
The resulting []byte are written to the http.ResponseWriter with a sensible Content-Type: image/png header.
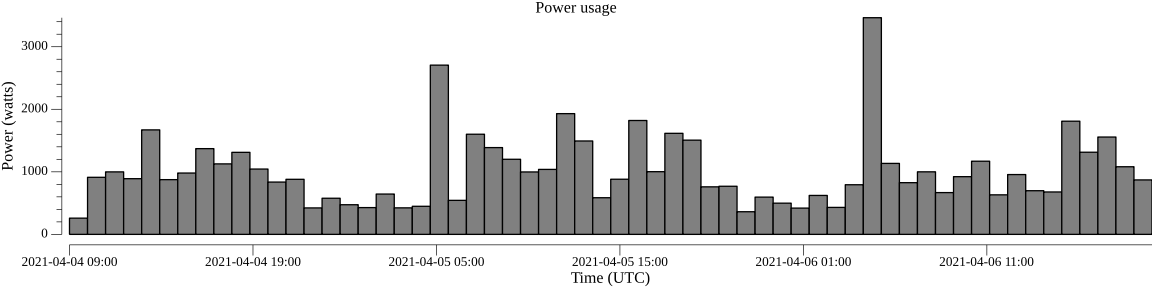
With everything wired up, we can enter the address to our API Gateway and produce nice graphs directly in our browser:
https://omitted.execute-api.eu-west-1.amazonaws.com/?output=png&from=2021-04-04&aggregate=1h&graph=hist
This sums up part 2 of this blog series about using AWS services + CDK + Golang to monitor energy usage in my home.
I’m planning on extending this solution with a home-brewed solution for automatic scheduling of electric vehicle charging given hourly electricity prices and hopefully some more interesting integrations with cloud APIs and AWS services.