Blogg
Här finns tekniska artiklar, presentationer och nyheter om arkitektur och systemutveckling. Håll dig uppdaterad, följ oss på LinkedIn
Här finns tekniska artiklar, presentationer och nyheter om arkitektur och systemutveckling. Håll dig uppdaterad, följ oss på LinkedIn

This is the third part of a short blog-series about using CDK and AWS services to build and deploy a personal solution for monitoring electricity usage. This part is just a little follow-up on how the solution is doing, some improvements and most importantly - the costs I’ve been billed since the solution’s inception back in april.
The full CDK and Go source code for this project can be found here: https://github.com/eriklupander/powertracker
Note: I am in no way affiliated with or working for Tibber, Easee, AWS or any other company or service provider mentioned in this blog post. I’m only doing this for educational purposes and personal enjoyment.
As a short recap from part 1, here’s the system overview:
![]()
So, since april 2021, my “recorder” lambda has happily been executing every five minutes, setting up that short-lived GraphQL subscription against the Tibber API, recording the electricity usage and storing the retrieved value in the AWS TimeStream database.
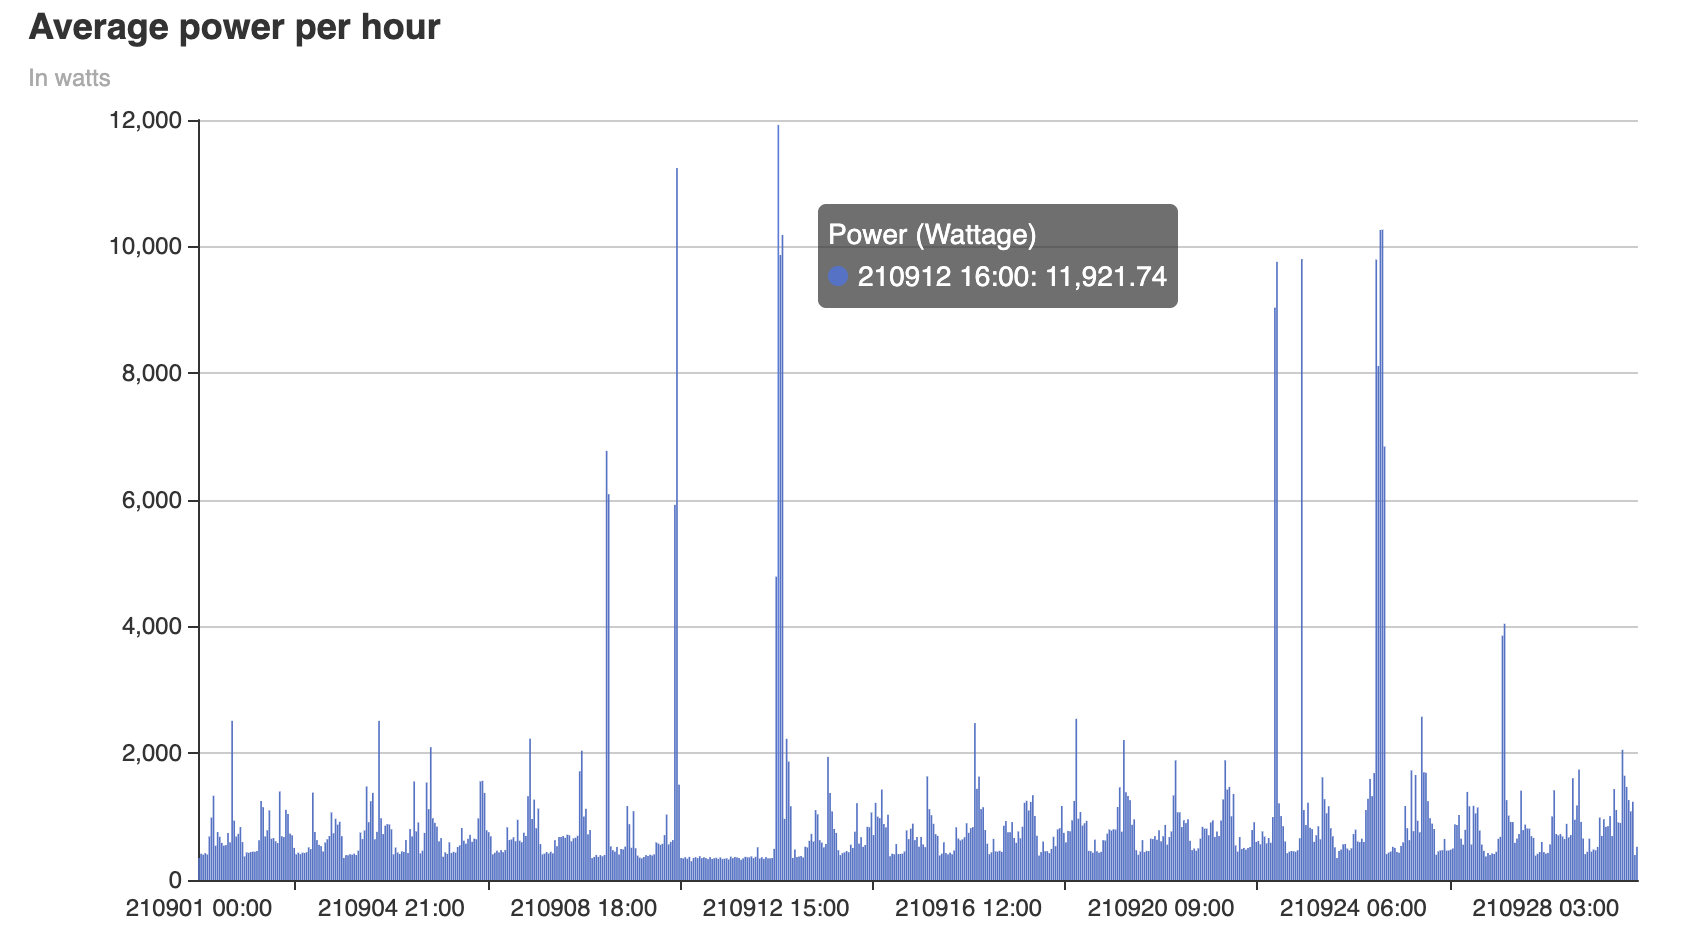
Here’s an excerpt from september in the new HTML report:
And here’s a goplot graph from the first half of september:
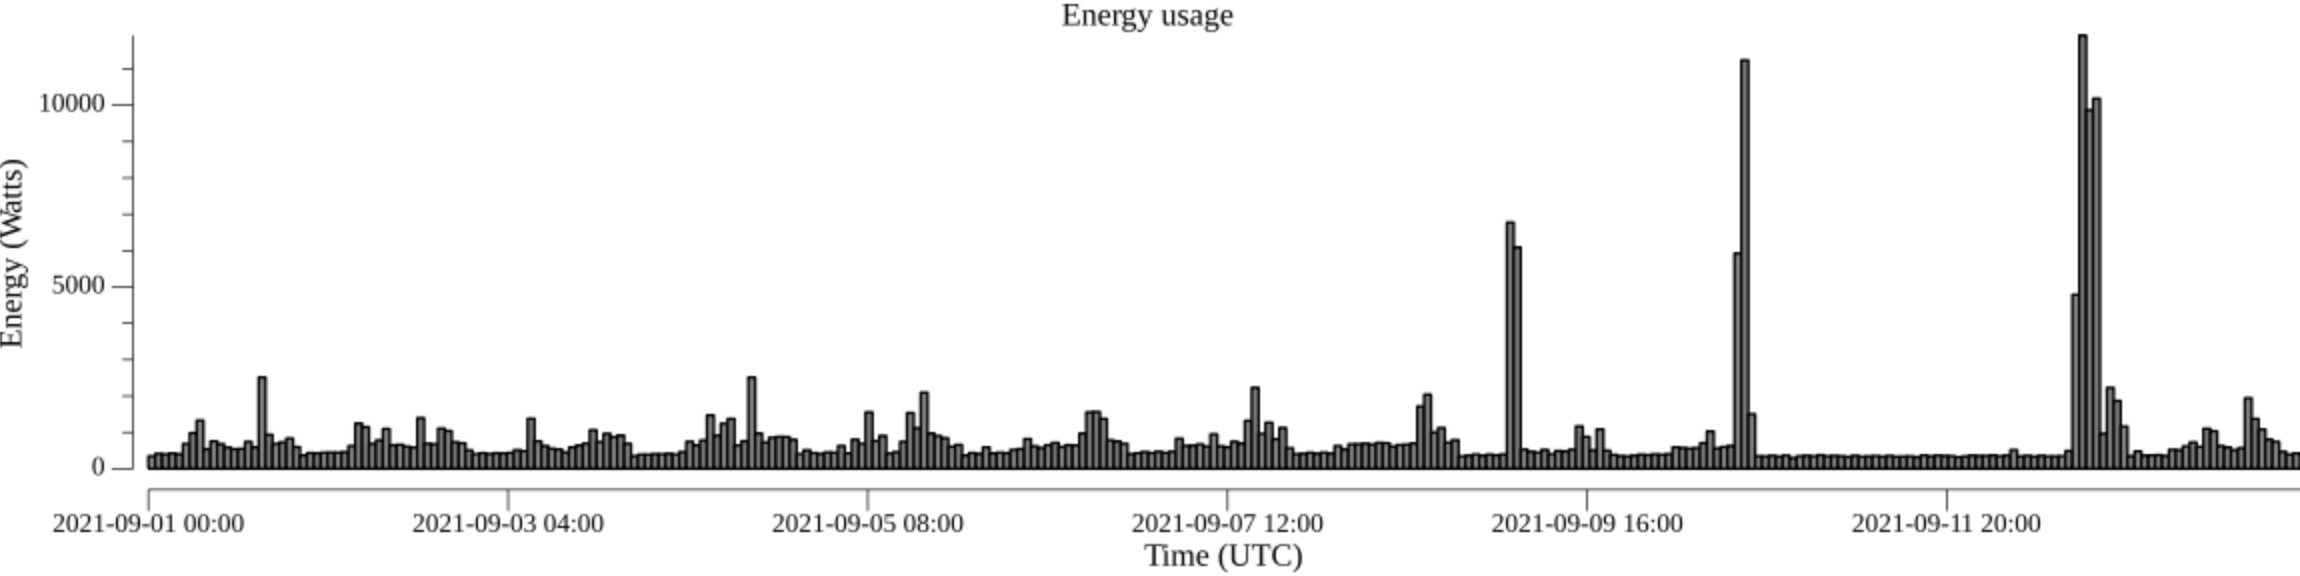
While the usefulness of this data can be argued, one can clearly see that due to pandemic work-from-home and limited travelling, we’re not charging our electric vehicle very often. However, when we do charge it - we’re indeed pulling the max 11 kW AC current the EV accepts with a bit to spare on my house’s 20A main.
As seen above, I’ve added HTML-based reporting based on the awesome https://github.com/go-echarts/go-echarts library.
The overall solution for serving these new HTML reports works pretty much the same as the existing goplot reports, i.e:
Here’s a code snippet showing how we transform go-linq aggregated entries into go-echarts XAxis (time) and opts.BarData (usage) representations before calling Render:
    // ... of course some code before this excerpt...
	xData := make([]string, 0)
	barData := make([]opts.BarData, 0)
	for _, ex := range entries {
		e := ex
		xData = append(xData, e.Created.Format(timeFormat))
		barData = append(barData, opts.BarData{Value: toFixed(e.CurrentUsage, 2)})
	}

	// Put data into instance
	bar.SetXAxis(xData).
		AddSeries("Power (Wattage)", barData)

	out := new(bytes.Buffer)
	err := bar.Render(out)

    // ... and of course some more code afterwards as well!
This blog post isn’t meant to be a go-echarts tutorial, so if you’re interested in that, check out their github repo.
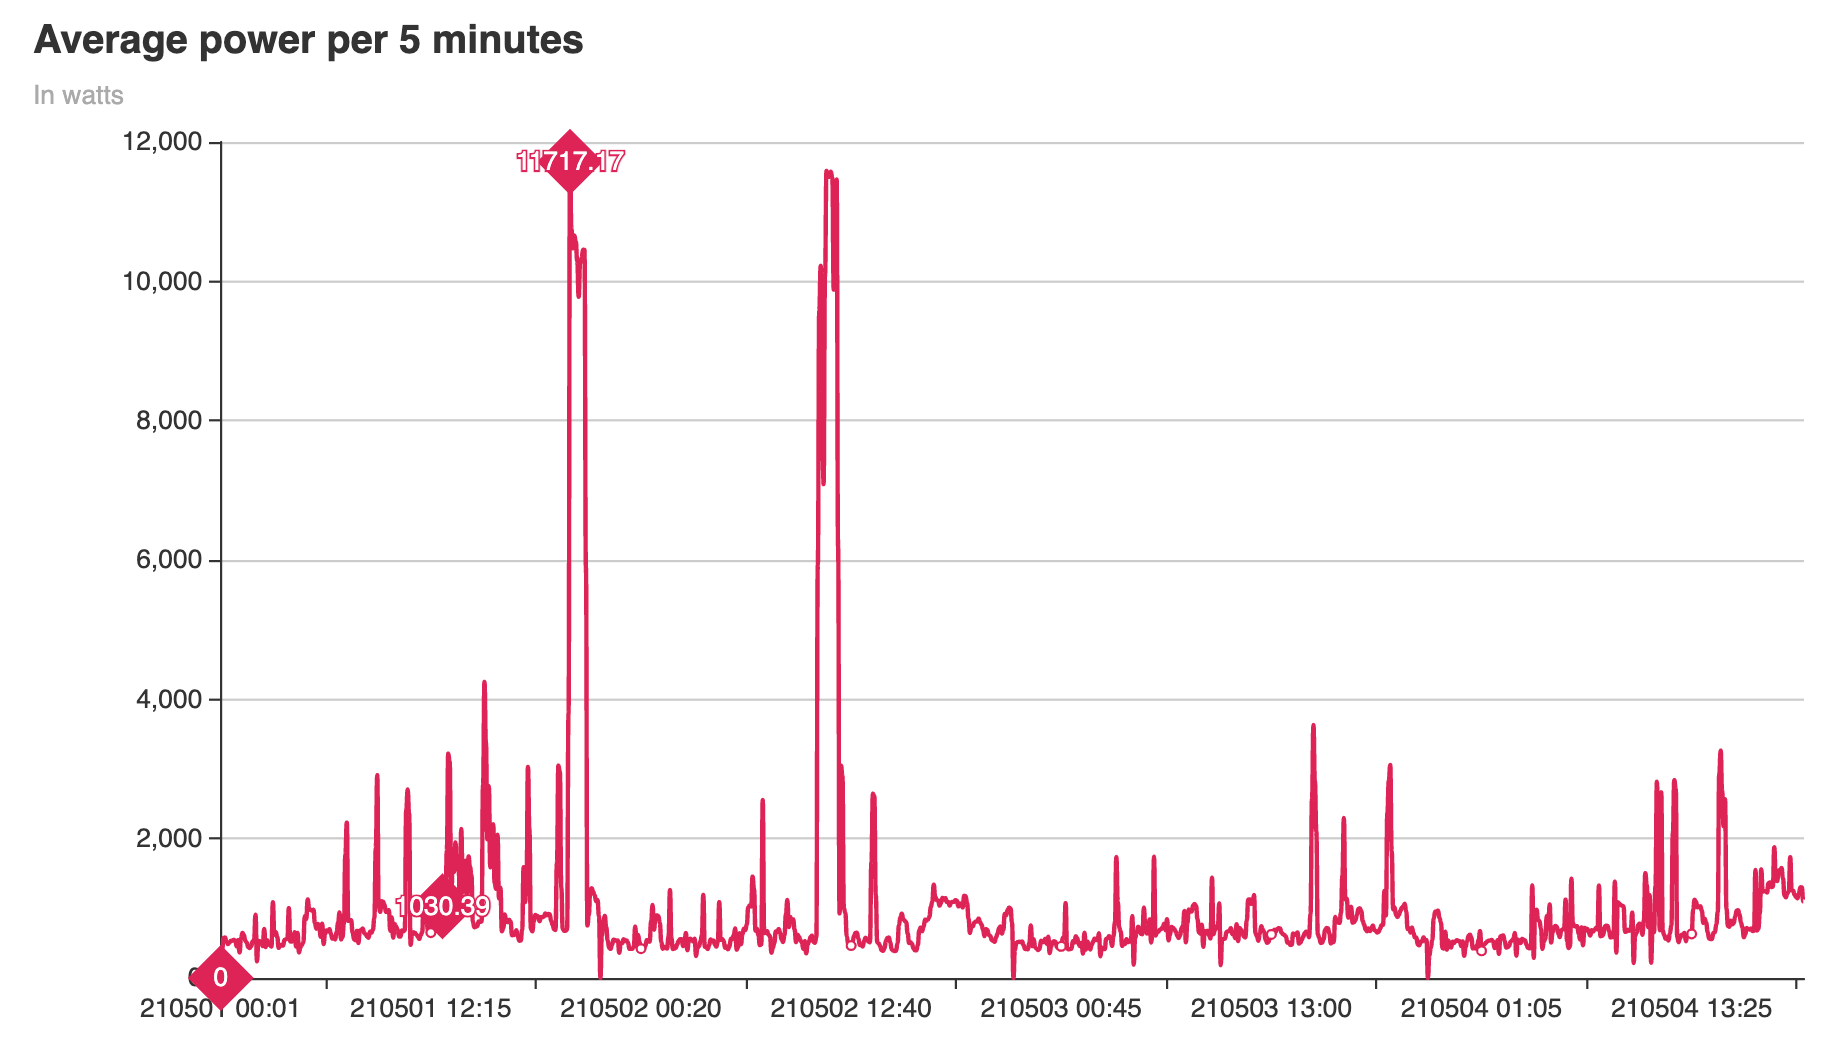
go-echarts can do all sorts of neat stuff, including both bar-charts as seen above, as well as this line-chart with min/max/mean values plotted on data from May 2021.
This is actually the main reason for this little follow up. How much has this little solution set me back over the last 6 months or so?
As a recap, the solution is built on the following AWS services:
How many records have we ingested into AWS TimeStream? A simple query tells us:
SELECT COUNT(*)
 from powertracker.power_record pr

43686
(As a sidenote, my Watty energy monitor has silently crashed a few times including most of july - requiring a manual reboot to produce data again - so there’s actually fewer records than there should be given the time frame)
The exact number of lambda execution milliseconds I’ve used isn’t that high, since each full “recorder” invocation uses less than 300 ms on average. 12 calls/hour * 24h * 30 days equals approx 8640 recorder calls per month, which keeps me well within the AWS lambda free tier. As far as I can tell - the API Gateway and Lambda calls has this far been basically free of charge.
The numbers of the AWS billing report should speak for themselves:
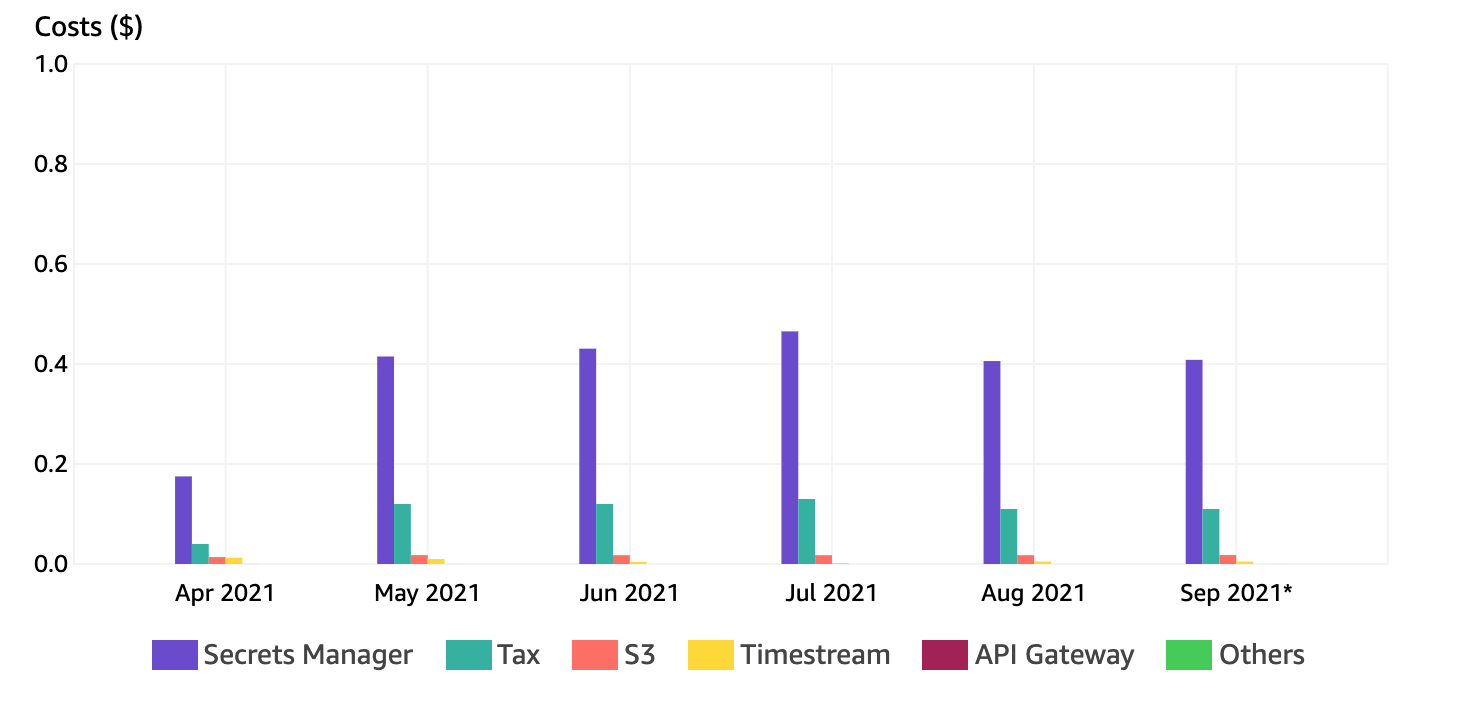
Yes, those numbers are correct. On average, the solution used sets me back less than $0.5 per month. And of those ~50 cents, the majority stems from my single AWS Secrets Manager secret and the tax that entails. S3 for storing my Go-based lambdas is just a few cents per month (about 20 Mb totally for the two Go-based lambdas packaged as docker images). AWS TimeStream billing is even less, perhaps in the single-cent range. I guess AWS TimeStream is usually used for storing substantially larger amounts of data, as well as running queries much more often than I do.
That’s it for this little update. The solution is humming along nicely and not setting me back by even a dollar per month.
I’ve yet to expand on the solution with some cool integrations including electricity pricing, price-optimized charge schedules and perhaps trying to access the VW API that can tell me the State-of-Charge on my car. Perhaps I’ll get around to that sometime.
In the meantime, I’m currently collecting some data on public fast DC-charger availability over time, since my travels this past summer revealed that the main issue here in Sweden with non-Tesla EVs isn’t EV range or max DC charge speed - it’s charger availability and being able to forecast charger availability on a longer trip may very well save both time and reduce frustration in my future travels. Hoping to get back to you on that in an upcoming blog post!